Estimated Value: $331,000 - $369,000
3
Beds
2
Baths
1,539
Sq Ft
$226/Sq Ft
Est. Value
About This Home
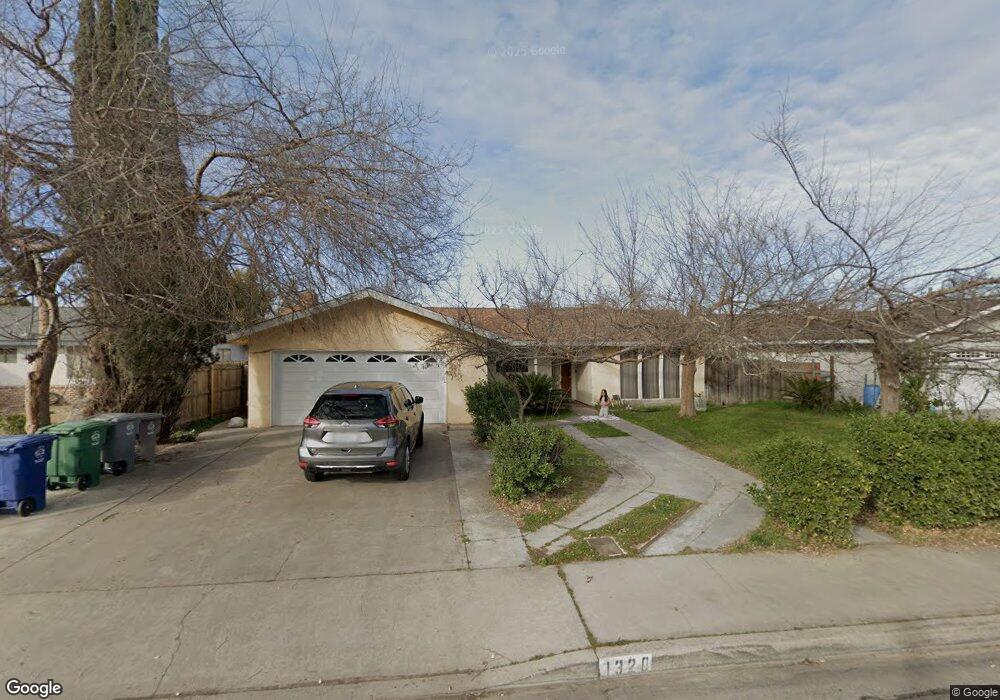
This home is located at 1320 Fig St, Selma, CA 93662 and is currently estimated at $348,438, approximately $226 per square foot. 1320 Fig St is a home located in Fresno County with nearby schools including Woodrow Wilson Elementary School, Abraham Lincoln Middle School, and Selma High School.
Ownership History
Date
Name
Owned For
Owner Type
Purchase Details
Closed on
Apr 24, 2025
Sold by
Cazares Elizabeth and Cazares Aldo
Bought by
Cazares Elizabeth and Sanchez Rosa Maria
Current Estimated Value
Purchase Details
Closed on
Apr 6, 2001
Sold by
Martinez Mel
Bought by
Cazarez Aldo and Cazarez Elizabeth
Purchase Details
Closed on
Jan 3, 2001
Sold by
Union Planters Mortgage
Bought by
Hud
Purchase Details
Closed on
Sep 16, 1998
Sold by
Ray Barron
Bought by
Union Planters Mtg
Create a Home Valuation Report for This Property
The Home Valuation Report is an in-depth analysis detailing your home's value as well as a comparison with similar homes in the area
Home Values in the Area
Average Home Value in this Area
Purchase History
| Date | Buyer | Sale Price | Title Company |
|---|---|---|---|
| Cazares Elizabeth | -- | None Listed On Document | |
| Cazarez Aldo | $86,500 | North American Title Company | |
| Hud | -- | -- | |
| Union Planters Mtg | $98,685 | Fidelity National Title Ins |
Source: Public Records
Tax History
| Year | Tax Paid | Tax Assessment Tax Assessment Total Assessment is a certain percentage of the fair market value that is determined by local assessors to be the total taxable value of land and additions on the property. | Land | Improvement |
|---|---|---|---|---|
| 2025 | $2,475 | $130,314 | $45,191 | $85,123 |
| 2023 | $2,393 | $125,255 | $43,437 | $81,818 |
| 2022 | $2,274 | $122,800 | $42,586 | $80,214 |
| 2021 | $2,215 | $120,393 | $41,751 | $78,642 |
| 2020 | $2,184 | $119,159 | $41,323 | $77,836 |
| 2019 | $2,119 | $116,823 | $40,513 | $76,310 |
| 2018 | $2,066 | $114,533 | $39,719 | $74,814 |
| 2017 | $1,987 | $112,289 | $38,941 | $73,348 |
| 2016 | $1,802 | $110,088 | $38,178 | $71,910 |
| 2015 | $1,823 | $108,435 | $37,605 | $70,830 |
| 2014 | $1,768 | $106,312 | $36,869 | $69,443 |
Source: Public Records
Map
Nearby Homes
- 1361 Almond St
- 1233 Redwood Ln
- 2406 B St
- 2482 Country Club Ln
- 0 Rose Ave
- 1517 Stillman St
- 2629 Mccall Ave
- 2002 Merced St
- 12623 S Mccall Ave
- 2841 C St
- 2226 Arrants St
- 2022 Bauder St
- 2850 Mccall Ave Unit A-F
- 2772 Valley View St
- 2980 Olive St
- 2232 Gaither St
- 2434 Yerba St
- 2221 Floral Ave
- 2546 Evergreen St
- 2591 Rose Ave
Your Personal Tour Guide
Ask me questions while you tour the home.