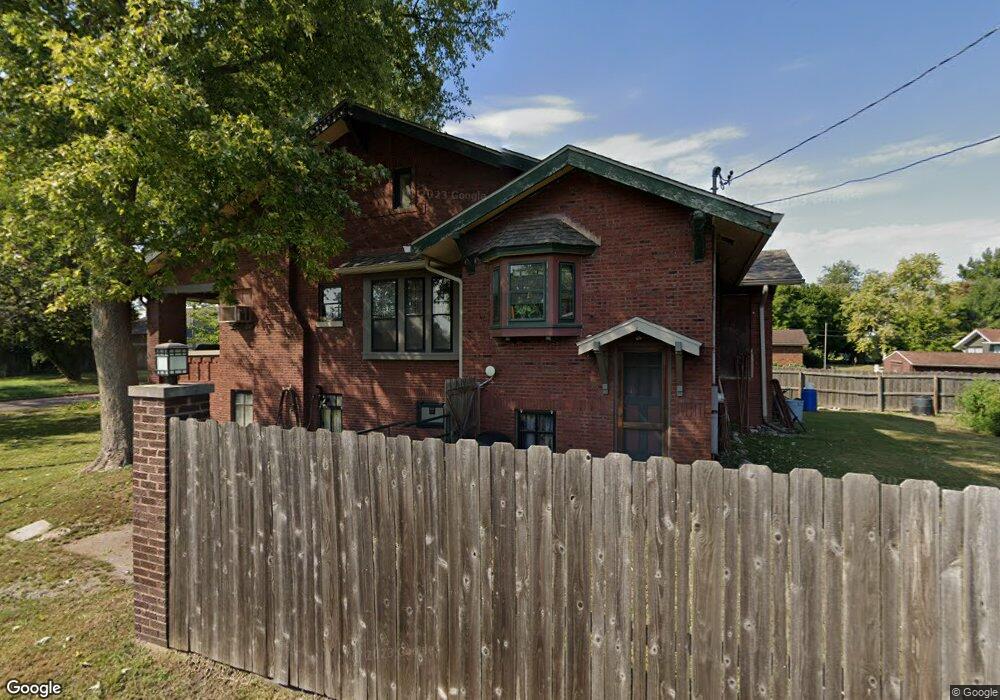
1320 Hanson St Murphysboro, IL 62966
Estimated Value: $80,000 - $126,000
Studio
--
Bath
1,442
Sq Ft
$76/Sq Ft
Est. Value
About This Home
This home is located at 1320 Hanson St, Murphysboro, IL 62966 and is currently estimated at $110,149, approximately $76 per square foot. 1320 Hanson St is a home located in Jackson County with nearby schools including Murphysboro High School, Montessori School of S. Illinois, and Murphysboro Christian Academy.
Ownership History
Date
Name
Owned For
Owner Type
Purchase Details
Closed on
Feb 19, 2021
Sold by
Baer Robert A
Bought by
Baer Robert A and Baer Kimberly L
Current Estimated Value
Purchase Details
Closed on
Jun 29, 2010
Sold by
Baer Cynthia
Bought by
Baer Robert
Home Financials for this Owner
Home Financials are based on the most recent Mortgage that was taken out on this home.
Original Mortgage
$80,000
Interest Rate
4.74%
Mortgage Type
Credit Line Revolving
Purchase Details
Closed on
Sep 23, 1999
Bought by
Baer Robert
Create a Home Valuation Report for This Property
The Home Valuation Report is an in-depth analysis detailing your home's value as well as a comparison with similar homes in the area
Home Values in the Area
Average Home Value in this Area
Purchase History
| Date | Buyer | Sale Price | Title Company |
|---|---|---|---|
| Baer Robert A | -- | None Available | |
| Baer Robert | -- | None Available | |
| Baer Robert | $63,000 | -- |
Source: Public Records
Mortgage History
| Date | Status | Borrower | Loan Amount |
|---|---|---|---|
| Previous Owner | Baer Robert | $80,000 |
Source: Public Records
Tax History
| Year | Tax Paid | Tax Assessment Tax Assessment Total Assessment is a certain percentage of the fair market value that is determined by local assessors to be the total taxable value of land and additions on the property. | Land | Improvement |
|---|---|---|---|---|
| 2024 | $2,871 | $33,987 | $3,839 | $30,148 |
| 2023 | $2,632 | $30,155 | $3,406 | $26,749 |
| 2022 | $2,461 | $27,640 | $3,122 | $24,518 |
| 2021 | $2,340 | $25,931 | $2,929 | $23,002 |
| 2020 | $2,334 | $25,621 | $2,894 | $22,727 |
| 2019 | $2,150 | $25,176 | $2,844 | $22,332 |
| 2018 | $2,700 | $31,766 | $2,844 | $28,922 |
| 2017 | $2,701 | $31,766 | $2,844 | $28,922 |
| 2016 | $2,636 | $31,766 | $2,844 | $28,922 |
| 2015 | -- | $31,766 | $2,844 | $28,922 |
| 2014 | -- | $31,462 | $2,844 | $28,618 |
| 2012 | -- | $31,462 | $2,844 | $28,618 |
Source: Public Records
Map
Nearby Homes
Your Personal Tour Guide
Ask me questions while you tour the home.