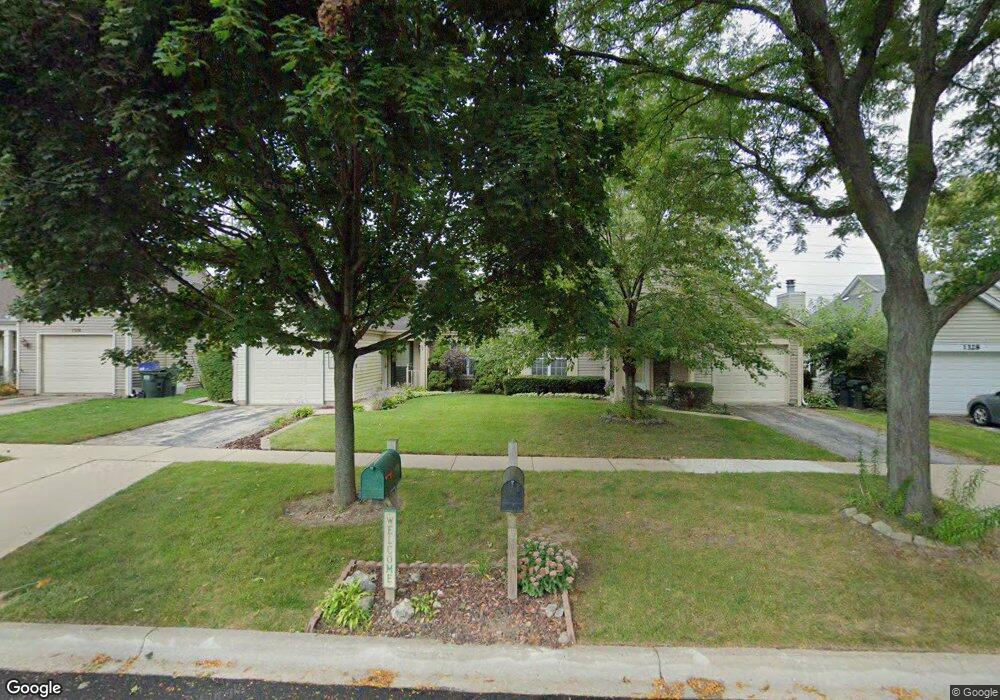
1320 Huntington Dr Mundelein, IL 60060
Cambridge Chase NeighborhoodEstimated Value: $295,675 - $359,000
--
Bed
2
Baths
1,192
Sq Ft
$265/Sq Ft
Est. Value
About This Home
This home is located at 1320 Huntington Dr, Mundelein, IL 60060 and is currently estimated at $315,919, approximately $265 per square foot. 1320 Huntington Dr is a home located in Lake County with nearby schools including Hawthorn Elementary School North, Hawthorn School Of Dual Language, and Hawthorn Middle School North.
Ownership History
Date
Name
Owned For
Owner Type
Purchase Details
Closed on
Jan 31, 2002
Sold by
Hixon Jonathon Patrick and Hixon Heather Anne
Bought by
Guilianelli Susan A
Current Estimated Value
Home Financials for this Owner
Home Financials are based on the most recent Mortgage that was taken out on this home.
Original Mortgage
$119,000
Outstanding Balance
$48,718
Interest Rate
6.92%
Estimated Equity
$267,201
Purchase Details
Closed on
Aug 10, 2000
Sold by
Pivarunas Sharen D
Bought by
Hixon Jonathon Patrick and Hixon Heather Anne
Home Financials for this Owner
Home Financials are based on the most recent Mortgage that was taken out on this home.
Original Mortgage
$149,847
Interest Rate
8.05%
Mortgage Type
FHA
Purchase Details
Closed on
Nov 23, 1998
Sold by
Rivelli John J and Rivelli Edith R
Bought by
Pivarunas Sharen D
Home Financials for this Owner
Home Financials are based on the most recent Mortgage that was taken out on this home.
Original Mortgage
$118,712
Interest Rate
6.95%
Mortgage Type
FHA
Create a Home Valuation Report for This Property
The Home Valuation Report is an in-depth analysis detailing your home's value as well as a comparison with similar homes in the area
Home Values in the Area
Average Home Value in this Area
Purchase History
| Date | Buyer | Sale Price | Title Company |
|---|---|---|---|
| Guilianelli Susan A | $169,000 | -- | |
| Hixon Jonathon Patrick | $151,000 | Lawyers Title Pick Up | |
| Pivarunas Sharen D | $129,000 | -- |
Source: Public Records
Mortgage History
| Date | Status | Borrower | Loan Amount |
|---|---|---|---|
| Open | Guilianelli Susan A | $119,000 | |
| Previous Owner | Hixon Jonathon Patrick | $149,847 | |
| Previous Owner | Pivarunas Sharen D | $118,712 |
Source: Public Records
Tax History Compared to Growth
Tax History
| Year | Tax Paid | Tax Assessment Tax Assessment Total Assessment is a certain percentage of the fair market value that is determined by local assessors to be the total taxable value of land and additions on the property. | Land | Improvement |
|---|---|---|---|---|
| 2024 | $5,567 | $76,744 | $16,717 | $60,027 |
| 2023 | $5,923 | $70,784 | $15,419 | $55,365 |
| 2022 | $5,923 | $64,139 | $14,820 | $49,319 |
| 2021 | $5,685 | $62,758 | $14,501 | $48,257 |
| 2020 | $5,176 | $58,210 | $13,450 | $44,760 |
| 2019 | $5,062 | $57,656 | $13,322 | $44,334 |
| 2018 | $4,594 | $53,447 | $12,598 | $40,849 |
| 2017 | $4,521 | $51,759 | $12,200 | $39,559 |
| 2016 | $4,313 | $49,074 | $11,567 | $37,507 |
| 2015 | $4,185 | $45,868 | $10,811 | $35,057 |
| 2014 | $4,618 | $42,264 | $9,130 | $33,134 |
| 2012 | $4,483 | $49,378 | $12,650 | $36,728 |
Source: Public Records
Map
Nearby Homes
- 1255 Huntington Dr
- 31 Washington Blvd Unit 108
- 49 N Shaddle Ave
- 701 Thomas Ct
- 1688 Saint Andrew Dr
- 215 Brice Ave
- 1726 Shoal Creek Terrace
- 1290 Butterfield Rd
- 640 Allanson Rd
- 422 Shadow Creek Dr
- 841 Wilcox St
- 510 S Hickory St
- 328 Brice Ave
- 900 S Butterfield Rd
- 433 E High St
- 422 James Ave
- 2245 Hazeltime Dr
- 1654 Pebble Beach Way
- 847 Mckinley Ave
- 342 Allanson Rd
- 1324 Huntington Dr
- 1316 Huntington Dr
- 1312 Huntington Dr
- 1312 Huntington Dr
- 1312 Huntington Dr Unit 1312
- 1328 Huntington Dr
- 1328 Huntington Dr
- 1328 Huntington Dr
- 1308 Huntington Dr Unit 5B
- 1332 Huntington Dr
- 1304 Huntington Dr Unit 5B
- 2 Bedford Rd
- 1336 Huntington Dr
- 1300 Huntington Dr
- 1295 Huntington Dr
- 6 Bedford Rd
- 1291 Huntington Dr
- 249 Knightsbridge Dr
- 1340 Huntington Dr
- 1296 Huntington Dr