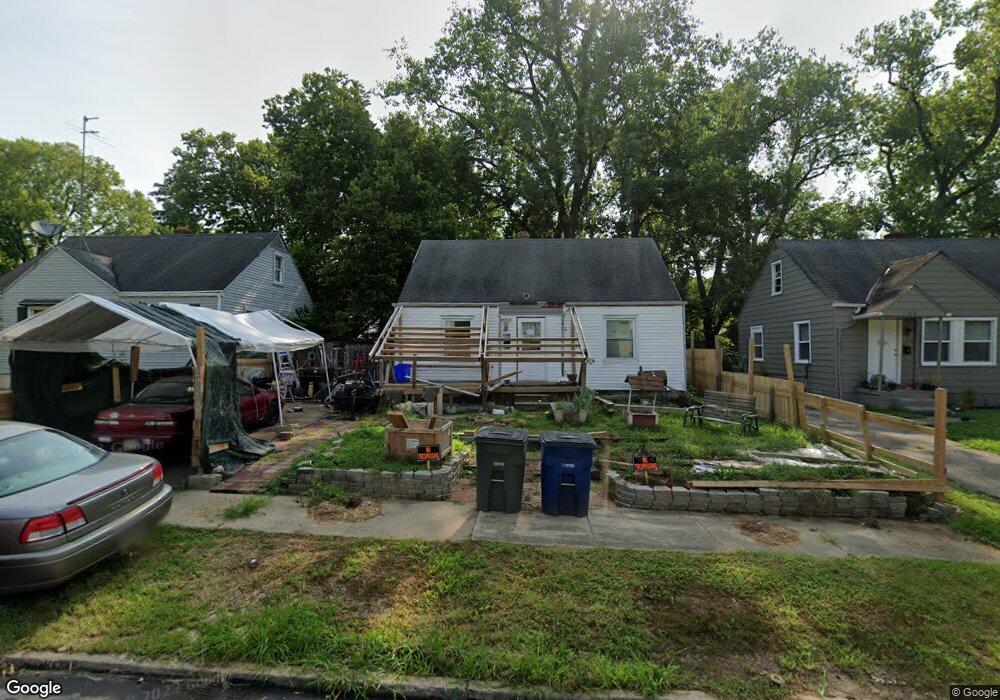
1320 Kingsley Ave Dayton, OH 45406
Cornell Heights NeighborhoodEstimated Value: $73,000 - $85,000
3
Beds
1
Bath
900
Sq Ft
$89/Sq Ft
Est. Value
About This Home
This home is located at 1320 Kingsley Ave, Dayton, OH 45406 and is currently estimated at $79,843, approximately $88 per square foot. 1320 Kingsley Ave is a home located in Montgomery County with nearby schools including Valerie Elementary School, Dayton Leadership Academies, and Deca Prep.
Ownership History
Date
Name
Owned For
Owner Type
Purchase Details
Closed on
Jul 14, 2023
Sold by
Locklinx Shonetta Scharrell
Bought by
Clark Jared
Current Estimated Value
Purchase Details
Closed on
Jul 7, 2023
Sold by
Clark Jared
Bought by
West Gregory A
Purchase Details
Closed on
Nov 6, 2018
Sold by
Tuner Nathaniel
Bought by
Locklin Shonetta
Purchase Details
Closed on
Mar 28, 2017
Sold by
Jones Harrison L
Bought by
Turner Nathaniel
Purchase Details
Closed on
Nov 29, 2016
Sold by
Jones Capria C
Bought by
Jones Harrison L
Purchase Details
Closed on
May 16, 2014
Sold by
Federal National Mortgage Association
Bought by
Jones Capria C
Purchase Details
Closed on
Jul 22, 2013
Sold by
Mcclain Stanley Elizabeth and Wells Fargo Bank Na
Bought by
Federal National Mortgage Association
Purchase Details
Closed on
Feb 26, 1998
Sold by
Robinson Sheila L
Bought by
Mclain Stanley Elizabeth and Ruffin Joshua Alexander
Create a Home Valuation Report for This Property
The Home Valuation Report is an in-depth analysis detailing your home's value as well as a comparison with similar homes in the area
Home Values in the Area
Average Home Value in this Area
Purchase History
| Date | Buyer | Sale Price | Title Company |
|---|---|---|---|
| Clark Jared | $700 | None Listed On Document | |
| West Gregory A | $6,500 | None Listed On Document | |
| Locklin Shonetta | $30,500 | None Available | |
| Turner Nathaniel | -- | None Available | |
| Jones Harrison L | -- | None Available | |
| Jones Capria C | $3,200 | Prism Title & Closing Svcs L | |
| Federal National Mortgage Association | $10,000 | None Available | |
| Mclain Stanley Elizabeth | -- | -- |
Source: Public Records
Tax History Compared to Growth
Tax History
| Year | Tax Paid | Tax Assessment Tax Assessment Total Assessment is a certain percentage of the fair market value that is determined by local assessors to be the total taxable value of land and additions on the property. | Land | Improvement |
|---|---|---|---|---|
| 2024 | $827 | $9,950 | $3,290 | $6,660 |
| 2023 | $827 | $9,950 | $3,290 | $6,660 |
| 2022 | $949 | $8,510 | $2,810 | $5,700 |
| 2021 | $932 | $8,510 | $2,810 | $5,700 |
| 2020 | $958 | $8,510 | $2,810 | $5,700 |
| 2019 | $1,242 | $10,660 | $3,300 | $7,360 |
| 2018 | $1,010 | $10,660 | $3,300 | $7,360 |
| 2017 | $892 | $10,660 | $3,300 | $7,360 |
| 2016 | $1,620 | $11,390 | $3,300 | $8,090 |
| 2015 | $944 | $11,390 | $3,300 | $8,090 |
| 2014 | $944 | $11,390 | $3,300 | $8,090 |
| 2012 | -- | $17,110 | $4,100 | $13,010 |
Source: Public Records
Map
Nearby Homes
- 1365 Alcott Dr
- 1251 Canfield Ave
- 1460 Kipling Dr
- 1419 Lexington Ave
- 3007 Cornell Dr
- 1045 Philadelphia Dr
- 3108 Campus Dr
- 1641 Kipling Dr
- 936 Walton Ave
- 3644 Karwin Dr Unit 3638
- 1124 Seneca Dr
- 1656 Tennyson Ave
- 3637 Stanford Place Unit 3631
- 1812 Haverhill Dr
- 1643 Earlham Dr
- 1200 Wilson Dr
- 1676 Tennyson Ave
- 1627 Harold Dr Unit 1621
- 3231 Harvard Blvd
- 24 Edith St
- 1316 Kingsley Ave
- 1326 Kingsley Ave
- 1312 Kingsley Ave
- 1330 Kingsley Ave
- 1301 Alcott Dr
- 1231 Alcott Dr
- 1311 Alcott Dr
- 1227 Alcott Dr
- 1304 Kingsley Ave
- 1334 Kingsley Ave
- 1227 Alcott Ave
- 1223 Alcott Dr
- 1315 Alcott Dr
- 1319 Kingsley Ave
- 1323 Kingsley Ave
- 1313 Kingsley Ave
- 1327 Kingsley Ave
- 1340 Kingsley Ave
- 1217 Alcott Dr
- 1319 Alcott Dr