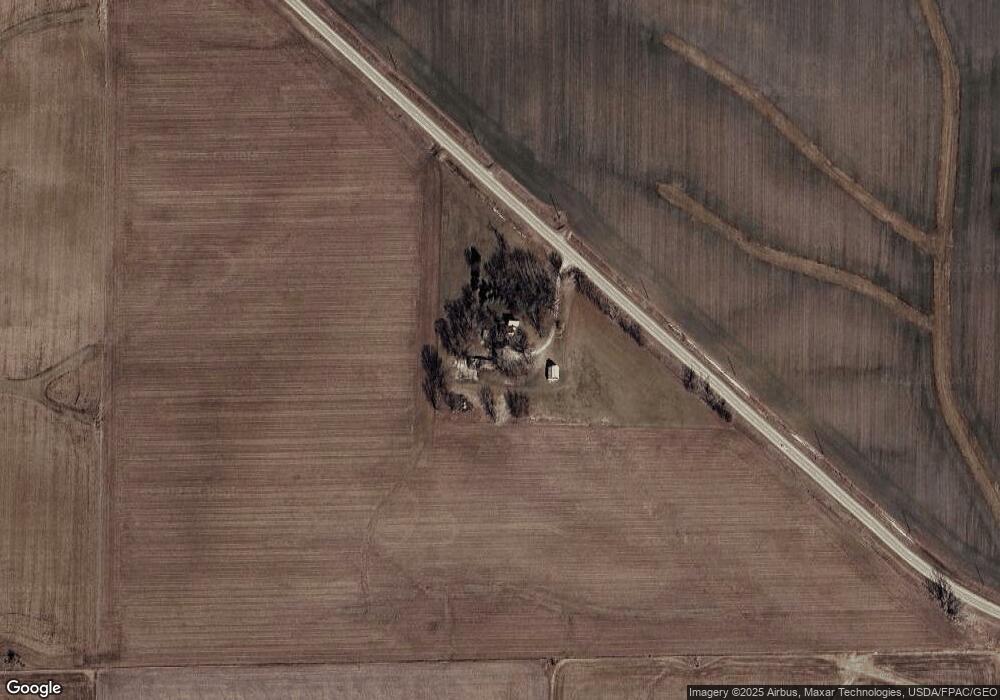
1320 Laporte Rd Brandon, IA 52210
Estimated Value: $180,000 - $274,000
3
Beds
2
Baths
1,679
Sq Ft
$142/Sq Ft
Est. Value
About This Home
This home is located at 1320 Laporte Rd, Brandon, IA 52210 and is currently estimated at $238,682, approximately $142 per square foot. 1320 Laporte Rd is a home located in Buchanan County with nearby schools including West Elementary School, East Elementary School, and Independence Junior/Senior High School.
Ownership History
Date
Name
Owned For
Owner Type
Purchase Details
Closed on
Jan 30, 2007
Sold by
Hopikins Annette
Bought by
Kurt Charles D
Current Estimated Value
Home Financials for this Owner
Home Financials are based on the most recent Mortgage that was taken out on this home.
Original Mortgage
$31,700
Outstanding Balance
$19,103
Interest Rate
6.27%
Mortgage Type
Stand Alone Second
Estimated Equity
$219,579
Create a Home Valuation Report for This Property
The Home Valuation Report is an in-depth analysis detailing your home's value as well as a comparison with similar homes in the area
Home Values in the Area
Average Home Value in this Area
Purchase History
| Date | Buyer | Sale Price | Title Company |
|---|---|---|---|
| Kurt Charles D | $158,500 | None Available |
Source: Public Records
Mortgage History
| Date | Status | Borrower | Loan Amount |
|---|---|---|---|
| Open | Kurt Charles D | $31,700 |
Source: Public Records
Tax History Compared to Growth
Tax History
| Year | Tax Paid | Tax Assessment Tax Assessment Total Assessment is a certain percentage of the fair market value that is determined by local assessors to be the total taxable value of land and additions on the property. | Land | Improvement |
|---|---|---|---|---|
| 2025 | $1,770 | $192,500 | $89,000 | $103,500 |
| 2024 | $1,770 | $151,370 | $68,770 | $82,600 |
| 2023 | $1,714 | $151,370 | $68,770 | $82,600 |
| 2022 | $1,598 | $123,520 | $55,000 | $68,520 |
| 2021 | $1,604 | $123,520 | $55,000 | $68,520 |
| 2020 | $1,604 | $113,210 | $50,000 | $63,210 |
| 2019 | $1,660 | $113,210 | $50,000 | $63,210 |
| 2018 | $1,560 | $110,550 | $50,000 | $60,550 |
| 2017 | $1,562 | $110,550 | $50,000 | $60,550 |
| 2016 | $1,530 | $107,950 | $36,890 | $71,060 |
| 2015 | $1,530 | $107,950 | $36,890 | $71,060 |
| 2014 | $1,580 | $107,950 | $36,890 | $71,060 |
Source: Public Records
Map
Nearby Homes