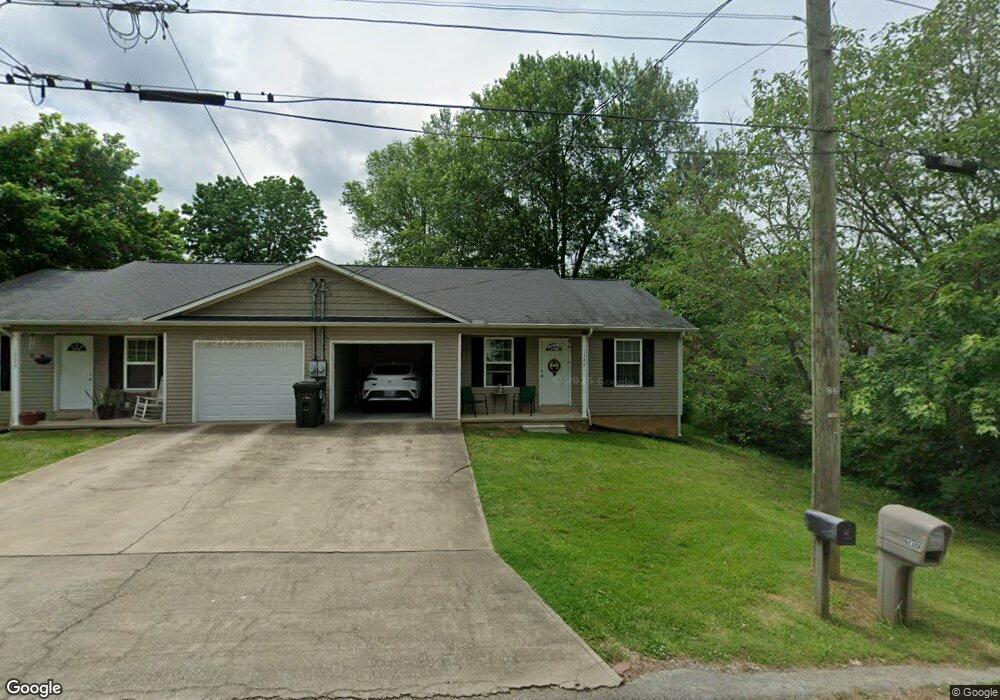
1320 Lewis St Morristown, TN 37813
Estimated Value: $296,000 - $330,000
4
Beds
2
Baths
2,006
Sq Ft
$155/Sq Ft
Est. Value
About This Home
This home is located at 1320 Lewis St, Morristown, TN 37813 and is currently estimated at $310,731, approximately $154 per square foot. 1320 Lewis St is a home located in Hamblen County with nearby schools including Hillcrest Elementary School, Meadowview Middle School, and Morristown East High School.
Ownership History
Date
Name
Owned For
Owner Type
Purchase Details
Closed on
Sep 11, 2008
Sold by
Francisco Cervantes Juan
Bought by
Lakins William Nicholas
Current Estimated Value
Purchase Details
Closed on
Sep 22, 2003
Sold by
Stout Dennis C
Bought by
Cervantes Juan F
Home Financials for this Owner
Home Financials are based on the most recent Mortgage that was taken out on this home.
Original Mortgage
$6,095
Interest Rate
6.28%
Purchase Details
Closed on
Aug 22, 1994
Sold by
Miser Rodney
Bought by
Lublmina Kustosik
Purchase Details
Closed on
Feb 21, 1992
Bought by
Miser Rodney and Miser Tonya
Purchase Details
Closed on
Oct 6, 1989
Bought by
Norton Barry
Purchase Details
Closed on
Jan 27, 1984
Bought by
Webber Lester C and Webber Carolyn
Purchase Details
Closed on
Sep 21, 1983
Bought by
Barry Norton
Purchase Details
Closed on
Aug 2, 1977
Bought by
Trent Ralph
Create a Home Valuation Report for This Property
The Home Valuation Report is an in-depth analysis detailing your home's value as well as a comparison with similar homes in the area
Home Values in the Area
Average Home Value in this Area
Purchase History
| Date | Buyer | Sale Price | Title Company |
|---|---|---|---|
| Lakins William Nicholas | $18,500 | -- | |
| Cervantes Juan F | $10,000 | -- | |
| Lublmina Kustosik | -- | -- | |
| Miser Rodney | $30,000 | -- | |
| Norton Barry | $19,000 | -- | |
| Webber Lester C | $17,700 | -- | |
| Barry Norton | -- | -- | |
| Trent Ralph | -- | -- |
Source: Public Records
Mortgage History
| Date | Status | Borrower | Loan Amount |
|---|---|---|---|
| Previous Owner | Trent Ralph | $6,095 |
Source: Public Records
Tax History Compared to Growth
Tax History
| Year | Tax Paid | Tax Assessment Tax Assessment Total Assessment is a certain percentage of the fair market value that is determined by local assessors to be the total taxable value of land and additions on the property. | Land | Improvement |
|---|---|---|---|---|
| 2024 | $1,250 | $71,000 | $8,080 | $62,920 |
| 2023 | $1,250 | $71,000 | $0 | $0 |
| 2022 | $2,244 | $71,000 | $8,080 | $62,920 |
| 2021 | $2,244 | $71,000 | $8,080 | $62,920 |
| 2020 | $2,241 | $71,000 | $8,080 | $62,920 |
| 2019 | $2,289 | $67,320 | $9,400 | $57,920 |
| 2018 | $2,121 | $67,320 | $9,400 | $57,920 |
| 2017 | $2,087 | $67,320 | $9,400 | $57,920 |
| 2016 | $1,993 | $67,320 | $9,400 | $57,920 |
| 2015 | $1,854 | $67,320 | $9,400 | $57,920 |
| 2014 | -- | $68,200 | $9,400 | $58,800 |
| 2013 | -- | $5,875 | $0 | $0 |
Source: Public Records
Map
Nearby Homes
- 0 Russell Cir
- 525 S Liberty Hill Rd
- 0 S Liberty Hill Rd Unit 703697
- 518 W Hillcrest Dr
- 1266 Liberty Hall Dr
- 1200 Liberty Hall Dr
- 808 Gaston St
- 1670 Oak St
- 460 Ash St
- 915 Forgey Ave
- 411 Ash St
- 1205 Ledford Ave
- 0 Joe Hall Rd Unit 703714
- 712 Williams St
- 000 Bacon Ln
- 819 Choctaw St
- 816 Choctaw St
- 831 Cave St
- 1829 Eastern Ave
- 926 E Main St