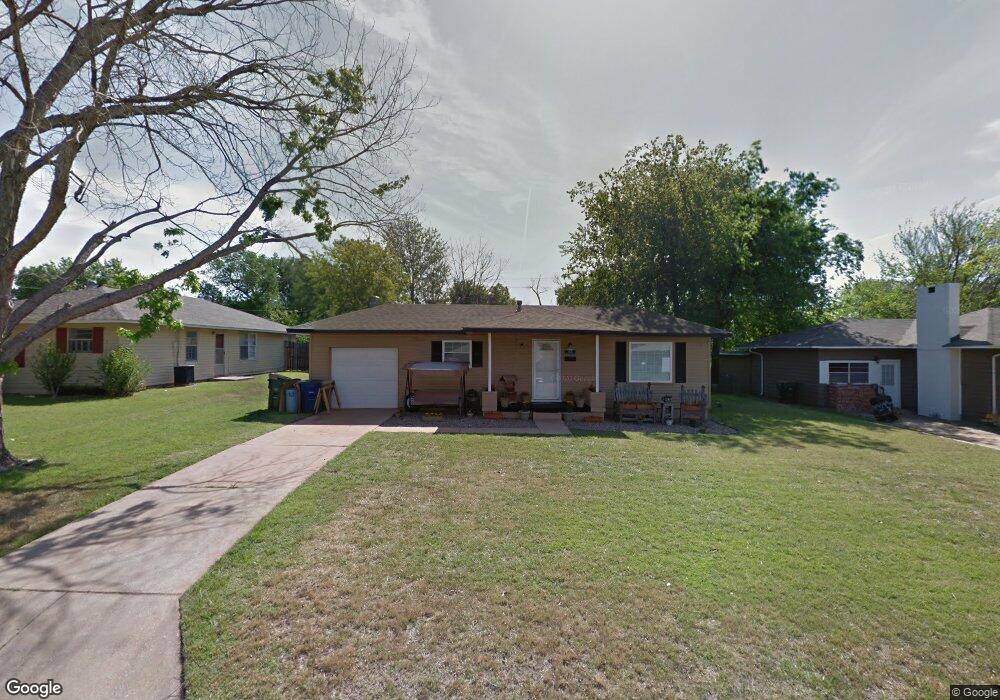
1320 N 13th St Duncan, OK 73533
Estimated Value: $92,859 - $192,000
3
Beds
3
Baths
1,952
Sq Ft
$72/Sq Ft
Est. Value
About This Home
This home is located at 1320 N 13th St, Duncan, OK 73533 and is currently estimated at $140,215, approximately $71 per square foot. 1320 N 13th St is a home located in Stephens County with nearby schools including Emerson Elementary School, Duncan Middle School, and Duncan High School.
Ownership History
Date
Name
Owned For
Owner Type
Purchase Details
Closed on
May 18, 2023
Sold by
Hekia Shannon N and Hekia Kevin
Bought by
Hekia Shannon N
Current Estimated Value
Home Financials for this Owner
Home Financials are based on the most recent Mortgage that was taken out on this home.
Original Mortgage
$137,159
Outstanding Balance
$133,118
Interest Rate
6.28%
Mortgage Type
FHA
Estimated Equity
$7,097
Purchase Details
Closed on
May 9, 2013
Sold by
Casady John C and Casady Johncarroll
Bought by
Casady Shannon Nicole
Purchase Details
Closed on
Feb 28, 2003
Sold by
Graham Investments
Purchase Details
Closed on
Sep 13, 2002
Sold by
Federal Natl Mtg Assoc
Purchase Details
Closed on
Apr 11, 2002
Sold by
Washington Mutual Home
Purchase Details
Closed on
Apr 1, 2002
Sold by
Stephens County Sheriff
Create a Home Valuation Report for This Property
The Home Valuation Report is an in-depth analysis detailing your home's value as well as a comparison with similar homes in the area
Home Values in the Area
Average Home Value in this Area
Purchase History
| Date | Buyer | Sale Price | Title Company |
|---|---|---|---|
| Hekia Shannon N | -- | None Listed On Document | |
| Casady Shannon Nicole | -- | None Available | |
| -- | $77,500 | -- | |
| -- | $15,500 | -- | |
| -- | -- | -- | |
| -- | -- | -- |
Source: Public Records
Mortgage History
| Date | Status | Borrower | Loan Amount |
|---|---|---|---|
| Open | Hekia Shannon N | $137,159 |
Source: Public Records
Tax History Compared to Growth
Tax History
| Year | Tax Paid | Tax Assessment Tax Assessment Total Assessment is a certain percentage of the fair market value that is determined by local assessors to be the total taxable value of land and additions on the property. | Land | Improvement |
|---|---|---|---|---|
| 2025 | $574 | $7,973 | $1,045 | $6,928 |
| 2024 | $574 | $7,741 | $1,045 | $6,696 |
| 2023 | $574 | $7,516 | $1,045 | $6,471 |
| 2022 | $663 | $7,794 | $1,045 | $6,749 |
| 2021 | $762 | $8,948 | $1,045 | $7,903 |
| 2020 | $627 | $8,258 | $1,045 | $7,213 |
| 2019 | $607 | $8,018 | $1,045 | $6,973 |
| 2018 | $604 | $8,018 | $1,045 | $6,973 |
| 2017 | $505 | $6,882 | $1,045 | $5,837 |
| 2016 | $542 | $7,380 | $1,045 | $6,335 |
| 2015 | $659 | $7,380 | $1,045 | $6,335 |
| 2014 | $659 | $7,380 | $1,045 | $6,335 |
Source: Public Records
Map
Nearby Homes
- 1412 N 12th St
- 1402 1402 W Elk Ave
- 1508 1508 N 13th St
- 1202 N Grand Blvd
- 1107 W Elk Ave
- 1405 Evergreen Dr
- 1114 N 13th St
- 1112 1112 N 12th
- 1105 1105 N Grand Ave
- 1404 1404 Ne Aspen
- 1527 1527 N 13th
- 1312 Pkwy
- 1001 1001 W Hackberry
- 1601 1601 Pearl
- 815 N 14th St
- 812 N 15th St
- 1112 W Spruce St
- 1444 1444 N 8th St
- 810 810 N 12th St
- 1807 W Chisholm Dr
- 1316 N 13th St
- 1322 N 13th St
- 1310 N 13th St
- 1315 N Grand Blvd
- 1309 N Grand Blvd
- 1317 N Grand Blvd
- 1313 N 13th St
- 1311 N 13th St
- 1308 N 13th St
- 1307 N Grand Blvd
- 1402 N 13th St
- 1291 W Jones Ave
- 1309 N 13th St
- 1402
- 1305 N Grand Blvd
- 1401 N Grand Blvd
- 1306 N 13th St
- 1307 N 13th St
- 1404 N 13th St
- 1316 1316 N Grand