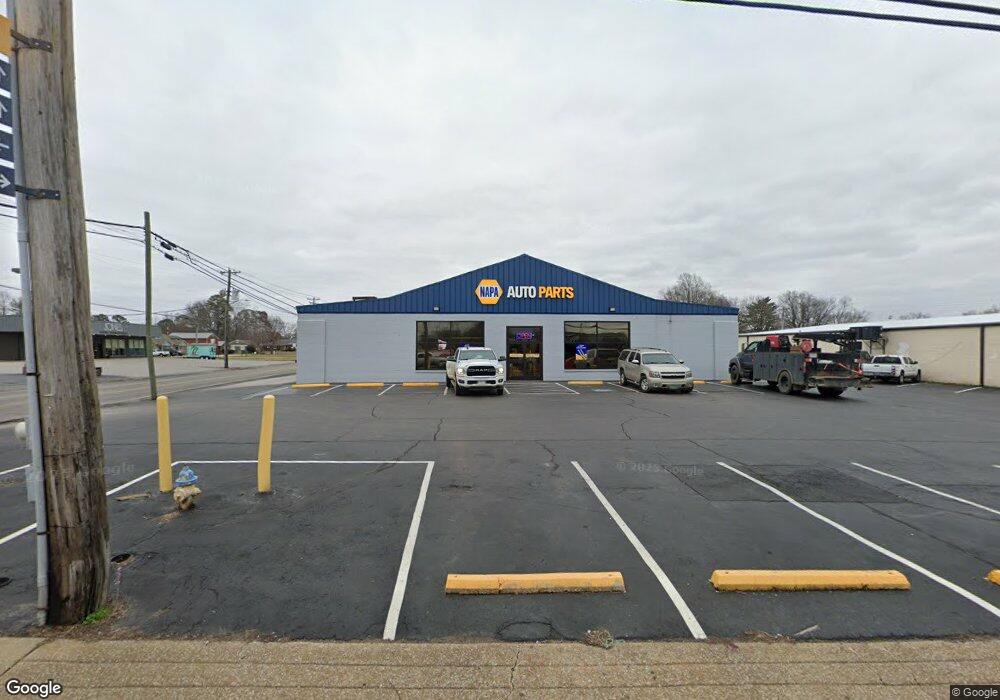
1320 N Locust Ave Lawrenceburg, TN 38464
Estimated Value: $1,532,092
--
Bed
1
Bath
12,500
Sq Ft
$123/Sq Ft
Est. Value
About This Home
This home is located at 1320 N Locust Ave, Lawrenceburg, TN 38464 and is currently estimated at $1,532,092, approximately $122 per square foot. 1320 N Locust Ave is a home located in Lawrence County with nearby schools including Ingram Sowell Elementary School, Lawrenceburg Public Elementary School, and David Crockett Elementary School.
Ownership History
Date
Name
Owned For
Owner Type
Purchase Details
Closed on
May 25, 2023
Sold by
Methvin Keith and Methvin Leslie
Bought by
Jc Real Estate Holdings Llc
Current Estimated Value
Home Financials for this Owner
Home Financials are based on the most recent Mortgage that was taken out on this home.
Original Mortgage
$1,040,000
Outstanding Balance
$1,010,444
Interest Rate
6.27%
Mortgage Type
New Conventional
Estimated Equity
$521,648
Purchase Details
Closed on
Dec 28, 2012
Sold by
Methvin Max S
Bought by
Methvin Keith and Methvin Leslie
Purchase Details
Closed on
Jan 26, 2006
Sold by
Killen W O
Bought by
Trace Properties Llc
Purchase Details
Closed on
Aug 3, 1984
Bought by
Methvin Max
Purchase Details
Closed on
Dec 4, 1979
Bought by
Methvin Max
Purchase Details
Closed on
Jan 2, 1900
Create a Home Valuation Report for This Property
The Home Valuation Report is an in-depth analysis detailing your home's value as well as a comparison with similar homes in the area
Home Values in the Area
Average Home Value in this Area
Purchase History
| Date | Buyer | Sale Price | Title Company |
|---|---|---|---|
| Jc Real Estate Holdings Llc | $1,300,000 | None Listed On Document | |
| Jc Real Estate Holdings Llc | $1,300,000 | None Listed On Document | |
| Methvin Keith | -- | -- | |
| Methvin Keith | -- | -- | |
| Trace Properties Llc | $200,000 | -- | |
| Methvin Max | -- | -- | |
| Methvin Max | -- | -- | |
| -- | -- | -- |
Source: Public Records
Mortgage History
| Date | Status | Borrower | Loan Amount |
|---|---|---|---|
| Open | Jc Real Estate Holdings Llc | $1,040,000 | |
| Closed | Jc Real Estate Holdings Llc | $1,040,000 |
Source: Public Records
Tax History Compared to Growth
Tax History
| Year | Tax Paid | Tax Assessment Tax Assessment Total Assessment is a certain percentage of the fair market value that is determined by local assessors to be the total taxable value of land and additions on the property. | Land | Improvement |
|---|---|---|---|---|
| 2025 | $7,510 | $241,640 | $0 | $0 |
| 2024 | $4,967 | $241,640 | $80,640 | $161,000 |
| 2023 | $4,967 | $241,640 | $80,640 | $161,000 |
| 2022 | $4,967 | $159,800 | $80,640 | $79,160 |
| 2021 | $6,008 | $136,680 | $80,640 | $56,040 |
| 2020 | $6,008 | $136,680 | $80,640 | $56,040 |
| 2019 | $6,008 | $136,680 | $80,640 | $56,040 |
| 2018 | $6,008 | $136,680 | $80,640 | $56,040 |
| 2017 | $6,008 | $136,680 | $80,640 | $56,040 |
| 2016 | $6,008 | $136,680 | $80,640 | $56,040 |
| 2015 | $5,689 | $136,680 | $80,640 | $56,040 |
| 2014 | $5,710 | $137,200 | $80,640 | $56,560 |
Source: Public Records
Map
Nearby Homes
- 1400 N Locust Ave
- 304 Ellingson St
- 306 Ellingson St
- 319 Weakley Creek Rd
- 316 Weakley Creek Rd
- 308 Ellingson St
- 310 Weakley Creek Rd
- 321 Weakley Creek Rd
- 310 Ellingson St
- 309 Ellingson St
- 1214 N Locust Ave
- 318 Weakley Creek Rd
- 1221 Poplar Dr
- 322 Weakley Creek Rd
- 106 Weakley Creek Rd
- 1217 Poplar Dr
- 1407 N Locust Ave
- 103 Weakley Creek Rd
- 1215 Poplar Dr
- 1409 N Locust Ave