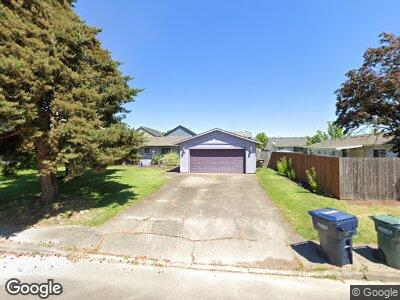
1320 Picture St Independence, OR 97351
Estimated Value: $357,000 - $402,000
4
Beds
2
Baths
1,296
Sq Ft
$291/Sq Ft
Est. Value
About This Home
This home is located at 1320 Picture St, Independence, OR 97351 and is currently estimated at $377,736, approximately $291 per square foot. 1320 Picture St is a home located in Polk County with nearby schools including Ash Creek Elementary School, Talmadge Middle School, and Central High School.
Ownership History
Date
Name
Owned For
Owner Type
Purchase Details
Closed on
Aug 15, 2019
Sold by
Moschetti Dawna J
Bought by
Milian Richard L and Moschetti Dawna J
Current Estimated Value
Home Financials for this Owner
Home Financials are based on the most recent Mortgage that was taken out on this home.
Original Mortgage
$238,000
Interest Rate
3.7%
Mortgage Type
VA
Purchase Details
Closed on
Oct 3, 2005
Sold by
Moschetti Dawna J and Moschatti Dawna J
Bought by
Moschetti Dawna J
Home Financials for this Owner
Home Financials are based on the most recent Mortgage that was taken out on this home.
Original Mortgage
$124,000
Interest Rate
7.12%
Mortgage Type
Fannie Mae Freddie Mac
Create a Home Valuation Report for This Property
The Home Valuation Report is an in-depth analysis detailing your home's value as well as a comparison with similar homes in the area
Home Values in the Area
Average Home Value in this Area
Purchase History
| Date | Buyer | Sale Price | Title Company |
|---|---|---|---|
| Milian Richard L | -- | Servicelink | |
| Moschetti Dawna J | -- | Lawyers Title Ins |
Source: Public Records
Mortgage History
| Date | Status | Borrower | Loan Amount |
|---|---|---|---|
| Closed | Milian Richard L | $48,770 | |
| Closed | Milian Richard L | $243,763 | |
| Closed | Milian Richard L | $240,876 | |
| Closed | Milian Richard L | $238,000 | |
| Closed | Moschetti Dawna J | $171,200 | |
| Closed | Moschetti Dawna J | $135,845 | |
| Closed | Moschetti Dawna J | $142,341 | |
| Closed | Moschetti Dawna J | $141,983 | |
| Closed | Moschetti Dawna J | $146,559 | |
| Closed | Moschetti Dawna J | $145,800 | |
| Closed | Moschetti Dawna J | $124,000 |
Source: Public Records
Tax History Compared to Growth
Tax History
| Year | Tax Paid | Tax Assessment Tax Assessment Total Assessment is a certain percentage of the fair market value that is determined by local assessors to be the total taxable value of land and additions on the property. | Land | Improvement |
|---|---|---|---|---|
| 2025 | $2,941 | $167,240 | $53,370 | $113,870 |
| 2024 | $2,941 | $162,370 | $51,820 | $110,550 |
| 2023 | $3,016 | $157,650 | $50,310 | $107,340 |
| 2022 | $2,769 | $153,060 | $48,840 | $104,220 |
| 2021 | $2,739 | $148,610 | $47,410 | $101,200 |
| 2020 | $2,667 | $144,290 | $46,030 | $98,260 |
| 2019 | $2,598 | $140,090 | $44,690 | $95,400 |
| 2018 | $2,515 | $136,010 | $43,390 | $92,620 |
| 2017 | $2,501 | $132,050 | $42,120 | $89,930 |
| 2016 | $2,547 | $128,210 | $40,900 | $87,310 |
| 2015 | $2,415 | $124,480 | $39,710 | $84,770 |
| 2014 | $2,362 | $120,860 | $38,550 | $82,310 |
Source: Public Records
Map
Nearby Homes
- 521 Picture Place
- 820 Covey Run St
- 585 Airport Rd
- 510 16th St N
- 1390 Monmouth St
- 1135 Monmouth St
- 375 S 11th St
- 1379 Natalie Ct
- 141 S St Unit 64
- 141 S 17th St
- 112 S 6th St
- 1439 Falcon (-1441) Lp
- 1256 S 11th St
- 471 Williams St
- 558 S 7th St
- 0 Stryker Rd Unit 792158
- 785 F St
- 1089 H St
- 212 Picture St
- 411 Monmouth St
- 1320 Picture St
- 600 N 13th St
- 1330 Picture St
- 1321 Marigold Dr
- 1325 Marigold Dr
- 1315 Marigold Dr
- 1305 Marigold Dr
- 1340 Picture St
- 1329 Marigold Dr
- 1333 Marigold Dr
- 1325 Picture St
- 1337 Marigold Dr
- 1335 Picture St
- 590 N 13th St
- 601 N 13th St
- 1285 Marigold Dr
- 1345 Picture St
- 654 Wisteria St
- 611 Jasmine Cir
- 1345 Marigold Dr