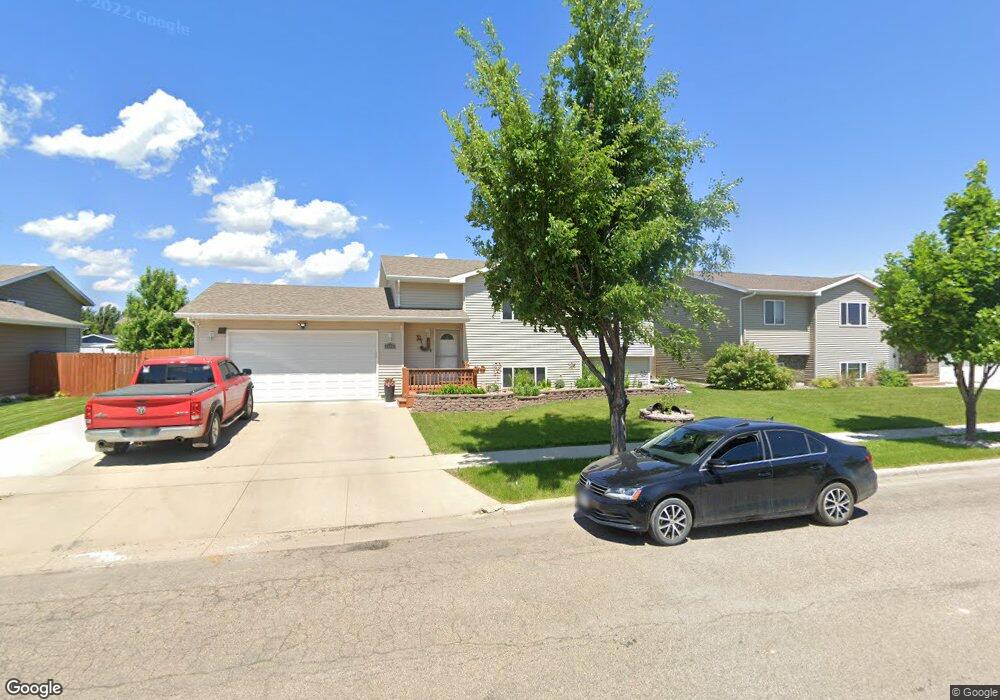
1320 Plum Ln Aberdeen, SD 57401
Estimated Value: $239,946 - $304,000
2
Beds
1
Bath
1,976
Sq Ft
$142/Sq Ft
Est. Value
About This Home
This home is located at 1320 Plum Ln, Aberdeen, SD 57401 and is currently estimated at $281,237, approximately $142 per square foot. 1320 Plum Ln is a home located in Brown County with nearby schools including Simmons Elementary School, Simmons Middle School, and Central High School.
Ownership History
Date
Name
Owned For
Owner Type
Purchase Details
Closed on
Dec 19, 2014
Sold by
Cramer Braldey and Vanmeter Rebecca
Bought by
Vanmeter Rebecca
Current Estimated Value
Purchase Details
Closed on
May 27, 2011
Sold by
Alliance Construction Inc
Bought by
Cramer Bradley and Vanmeter Rebecca
Home Financials for this Owner
Home Financials are based on the most recent Mortgage that was taken out on this home.
Original Mortgage
$173,264
Outstanding Balance
$120,853
Interest Rate
4.96%
Mortgage Type
New Conventional
Estimated Equity
$160,384
Purchase Details
Closed on
Nov 11, 2010
Sold by
Homes Are Possible Inc
Bought by
Alliance Construction Inc
Home Financials for this Owner
Home Financials are based on the most recent Mortgage that was taken out on this home.
Original Mortgage
$17,900
Interest Rate
4.31%
Mortgage Type
Seller Take Back
Create a Home Valuation Report for This Property
The Home Valuation Report is an in-depth analysis detailing your home's value as well as a comparison with similar homes in the area
Home Values in the Area
Average Home Value in this Area
Purchase History
| Date | Buyer | Sale Price | Title Company |
|---|---|---|---|
| Vanmeter Rebecca | -- | None Available | |
| Cramer Bradley | $173,500 | None Available | |
| Alliance Construction Inc | $2,000 | None Available |
Source: Public Records
Mortgage History
| Date | Status | Borrower | Loan Amount |
|---|---|---|---|
| Open | Cramer Bradley | $173,264 | |
| Previous Owner | Alliance Construction Inc | $17,900 |
Source: Public Records
Tax History
| Year | Tax Paid | Tax Assessment Tax Assessment Total Assessment is a certain percentage of the fair market value that is determined by local assessors to be the total taxable value of land and additions on the property. | Land | Improvement |
|---|---|---|---|---|
| 2025 | $3,954 | $256,094 | $21,674 | $234,420 |
| 2024 | $3,915 | $238,621 | $22,343 | $216,278 |
| 2023 | $3,318 | $216,811 | $22,343 | $194,468 |
| 2022 | $3,306 | $190,961 | $21,937 | $169,024 |
| 2021 | $3,241 | $185,508 | $21,937 | $163,571 |
| 2020 | $3,152 | $180,115 | $21,937 | $158,178 |
| 2019 | $3,194 | $177,404 | $19,226 | $158,178 |
| 2018 | $2,993 | $177,404 | $19,226 | $158,178 |
| 2017 | -- | $172,885 | $19,226 | $153,659 |
| 2016 | -- | $169,872 | $0 | $169,872 |
| 2015 | -- | $166,859 | $0 | $166,859 |
| 2014 | -- | $168,053 | $0 | $168,053 |
| 2011 | -- | $16,647 | $0 | $0 |
Source: Public Records
Map
Nearby Homes
Your Personal Tour Guide
Ask me questions while you tour the home.