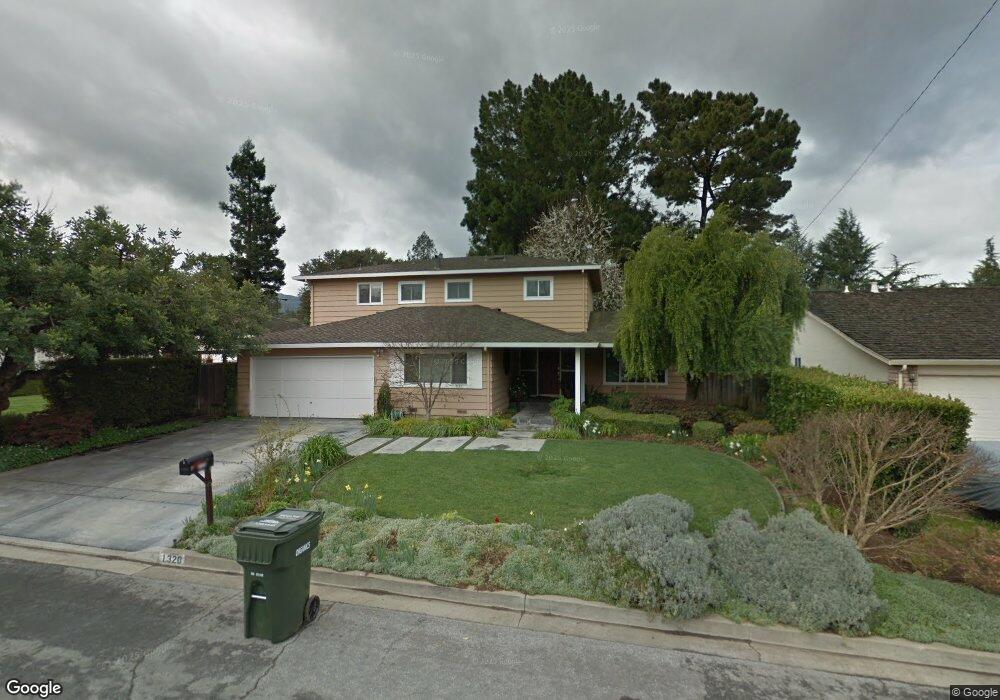
1320 Sunrise Ct Los Altos, CA 94024
South Los Altos NeighborhoodEstimated Value: $4,424,978 - $5,130,000
4
Beds
4
Baths
2,698
Sq Ft
$1,785/Sq Ft
Est. Value
About This Home
This home is located at 1320 Sunrise Ct, Los Altos, CA 94024 and is currently estimated at $4,816,995, approximately $1,785 per square foot. 1320 Sunrise Ct is a home located in Santa Clara County with nearby schools including Oak Avenue Elementary School, Georgina P. Blach Junior High School, and Mountain View High School.
Ownership History
Date
Name
Owned For
Owner Type
Purchase Details
Closed on
Nov 15, 1998
Sold by
Buchholz William M and Buchholz Susan W
Bought by
Bucholz William M and Bucholz Susan W
Current Estimated Value
Home Financials for this Owner
Home Financials are based on the most recent Mortgage that was taken out on this home.
Original Mortgage
$227,000
Interest Rate
6.54%
Purchase Details
Closed on
Nov 5, 1998
Sold by
Buchholz William M and Buchholz Susan W
Bought by
Buchholz William M and Buchholz Susan W
Home Financials for this Owner
Home Financials are based on the most recent Mortgage that was taken out on this home.
Original Mortgage
$227,000
Interest Rate
6.54%
Purchase Details
Closed on
Oct 7, 1994
Sold by
Buchholz William M and Buchholz Susan W
Bought by
Buchholz William M and Buchholz Susan W
Create a Home Valuation Report for This Property
The Home Valuation Report is an in-depth analysis detailing your home's value as well as a comparison with similar homes in the area
Home Values in the Area
Average Home Value in this Area
Purchase History
| Date | Buyer | Sale Price | Title Company |
|---|---|---|---|
| Bucholz William M | -- | North American Title Co | |
| Buchholz William M | -- | North American Title Co | |
| Buchholz William M | -- | -- |
Source: Public Records
Mortgage History
| Date | Status | Borrower | Loan Amount |
|---|---|---|---|
| Closed | Buchholz William M | $227,000 |
Source: Public Records
Tax History Compared to Growth
Tax History
| Year | Tax Paid | Tax Assessment Tax Assessment Total Assessment is a certain percentage of the fair market value that is determined by local assessors to be the total taxable value of land and additions on the property. | Land | Improvement |
|---|---|---|---|---|
| 2025 | $10,912 | $832,731 | $345,300 | $487,431 |
| 2024 | $10,912 | $816,404 | $338,530 | $477,874 |
| 2023 | $10,865 | $800,397 | $331,893 | $468,504 |
| 2022 | $10,840 | $784,704 | $325,386 | $459,318 |
| 2021 | $10,780 | $769,318 | $319,006 | $450,312 |
| 2020 | $10,405 | $743,987 | $315,735 | $428,252 |
| 2019 | $9,590 | $673,959 | $309,545 | $364,414 |
| 2018 | $9,281 | $660,745 | $303,476 | $357,269 |
| 2017 | $9,297 | $647,790 | $297,526 | $350,264 |
| 2016 | $8,882 | $635,090 | $291,693 | $343,397 |
| 2015 | $8,798 | $625,551 | $287,312 | $338,239 |
| 2014 | $8,501 | $613,298 | $281,684 | $331,614 |
Source: Public Records
Map
Nearby Homes
- 1260 Grant Rd
- 1051 Suffolk Way
- 1402 Oak Ave
- 941 Berry Ave
- 1315 Bright Oaks Ct
- 3363 Grant Rd
- 980-B Lundy Ln
- 781 Covington Rd
- 932 Lundy Ln
- 1686 Parkhills Ave
- 1887 Walnut Dr
- 1684 Newcastle Dr
- 1405 Montclaire Place
- 1624 Clay Dr
- 767 Cuesta Dr
- 763 Cuesta Dr
- 857 Hierra Ct
- 766 Cuesta Dr
- 1631 Grant Rd
- 1992 Deodara Dr
- 1310 Sunrise Ct
- 1330 Sunrise Ct
- 1340 Sunrise Ct
- 1300 Sunrise Ct
- 1325 Concord Ave
- 1335 Concord Ave
- 1315 Concord Ave
- 1325 Sunrise Ct
- 1335 Sunrise Ct
- 1315 Sunrise Ct
- 1350 Sunrise Ct
- 1345 Concord Ave
- 1160 Portland Ave
- 1345 Sunrise Ct
- 1305 Sunrise Ct
- 1355 Concord Ave
- 1360 Sunrise Ct
- 1355 Sunrise Ct
- 1310 Carvo Ct
- 1195 Portland Ave