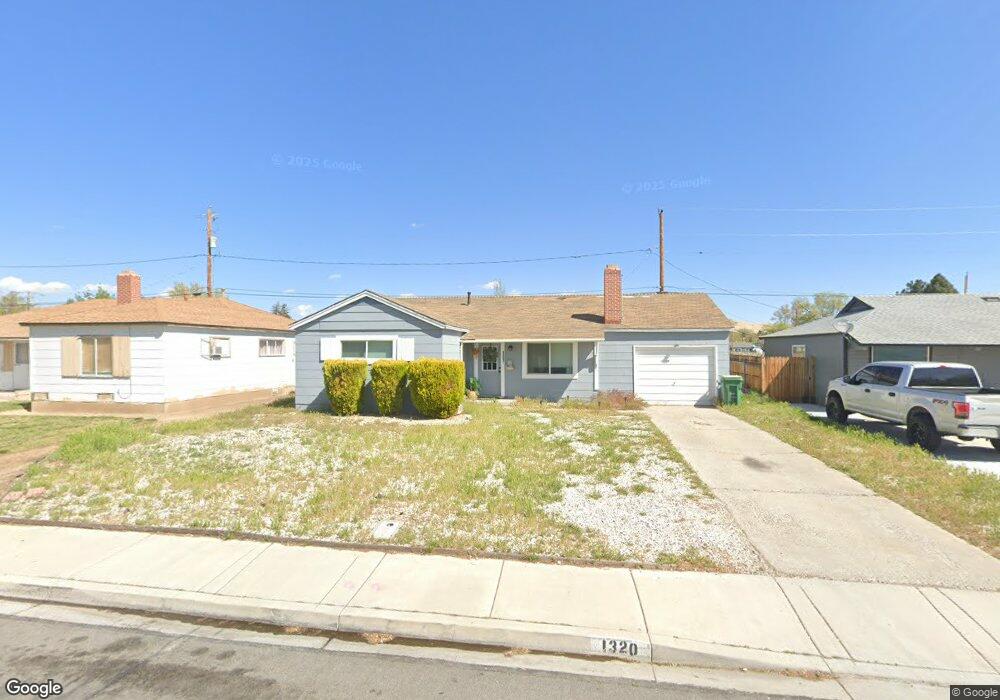
1320 Vance Way Sparks, NV 89431
North Rock NeighborhoodEstimated Value: $361,000 - $400,000
3
Beds
1
Bath
1,092
Sq Ft
$346/Sq Ft
Est. Value
About This Home
This home is located at 1320 Vance Way, Sparks, NV 89431 and is currently estimated at $377,812, approximately $345 per square foot. 1320 Vance Way is a home located in Washoe County with nearby schools including Alice Maxwell Elementary School, Sparks Middle School, and Sparks High School.
Ownership History
Date
Name
Owned For
Owner Type
Purchase Details
Closed on
Aug 21, 2019
Sold by
Naisbitt Kirk and Naisbitt Geri
Bought by
Naisbitt Rentals Llc
Current Estimated Value
Purchase Details
Closed on
Mar 8, 2006
Sold by
Naisbitt Kirk and Naisbitt Geri
Bought by
Naisbitt Kirk and Naisbitt Geri
Purchase Details
Closed on
Aug 7, 2003
Sold by
Naisbitt Kirk
Bought by
Naisbitt Kirk and Naisbitt Geri
Home Financials for this Owner
Home Financials are based on the most recent Mortgage that was taken out on this home.
Original Mortgage
$89,250
Interest Rate
5.17%
Mortgage Type
Unknown
Purchase Details
Closed on
Aug 6, 2003
Sold by
Haas Walter J
Bought by
Naisbitt Kirk
Home Financials for this Owner
Home Financials are based on the most recent Mortgage that was taken out on this home.
Original Mortgage
$89,250
Interest Rate
5.17%
Mortgage Type
Unknown
Purchase Details
Closed on
Mar 15, 2000
Sold by
Costa Bette M
Bought by
Costa Frank R and Costa Bette M
Create a Home Valuation Report for This Property
The Home Valuation Report is an in-depth analysis detailing your home's value as well as a comparison with similar homes in the area
Home Values in the Area
Average Home Value in this Area
Purchase History
| Date | Buyer | Sale Price | Title Company |
|---|---|---|---|
| Naisbitt Rentals Llc | -- | None Available | |
| Naisbitt Kirk | -- | None Available | |
| Naisbitt Kirk | $119,000 | Western Title Incorporated | |
| Naisbitt Kirk | $119,000 | Western Title Incorporated | |
| Costa Frank R | -- | -- |
Source: Public Records
Mortgage History
| Date | Status | Borrower | Loan Amount |
|---|---|---|---|
| Closed | Naisbitt Kirk | $89,250 |
Source: Public Records
Tax History Compared to Growth
Tax History
| Year | Tax Paid | Tax Assessment Tax Assessment Total Assessment is a certain percentage of the fair market value that is determined by local assessors to be the total taxable value of land and additions on the property. | Land | Improvement |
|---|---|---|---|---|
| 2025 | $648 | $47,447 | $31,325 | $16,122 |
| 2024 | $648 | $46,012 | $30,100 | $15,912 |
| 2023 | $630 | $44,623 | $29,890 | $14,733 |
| 2022 | $611 | $37,059 | $25,095 | $11,964 |
| 2021 | $594 | $28,466 | $16,765 | $11,701 |
| 2020 | $574 | $27,826 | $16,345 | $11,481 |
| 2019 | $558 | $26,753 | $15,890 | $10,863 |
| 2018 | $542 | $21,642 | $11,235 | $10,407 |
| 2017 | $528 | $20,371 | $10,150 | $10,221 |
| 2016 | $514 | $18,440 | $8,225 | $10,215 |
| 2015 | $513 | $17,174 | $7,140 | $10,034 |
| 2014 | $499 | $15,924 | $6,440 | $9,484 |
| 2013 | -- | $13,205 | $3,955 | $9,250 |
Source: Public Records
Map
Nearby Homes
- 1110 Xman Way
- 1124 Sbragia Way
- 1160 York Way
- 2154 Oppio St
- 1345 Plymouth Way
- 1595 York Way
- 1023 Tyler Way
- 1655 Byrd Dr
- 1003 Sbragia Way
- 1125 Dodson Way
- 1121 Greenbrae Dr
- 1365 Prospect Ave
- 1705 9th St
- 1799 Vance Way
- 0 N Mccarran Blvd Unit 250052909
- 1780 Greenbrae Dr
- 1731 Gault Way Unit D
- 3269 Valley Forge Way
- 1855 Verano Dr
- 1560 Steven Ct Unit 2