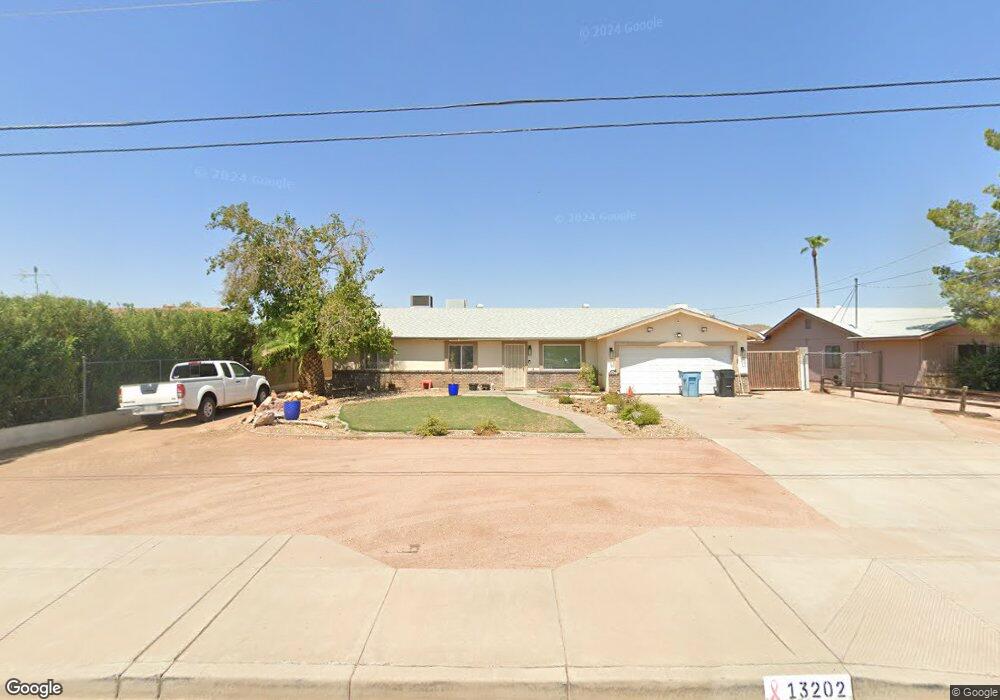
13202 N 36th St Phoenix, AZ 85032
Paradise Valley Village NeighborhoodEstimated Value: $549,949 - $608,000
--
Bed
2
Baths
1,756
Sq Ft
$335/Sq Ft
Est. Value
About This Home
This home is located at 13202 N 36th St, Phoenix, AZ 85032 and is currently estimated at $588,237, approximately $334 per square foot. 13202 N 36th St is a home located in Maricopa County with nearby schools including Indian Bend Elementary School, Shea Middle School, and Shadow Mountain High School.
Ownership History
Date
Name
Owned For
Owner Type
Purchase Details
Closed on
Sep 28, 2021
Sold by
Pantleo Dennis R and The Pantleo Neihart Living Tru
Bought by
16689 West Llc
Current Estimated Value
Purchase Details
Closed on
Sep 15, 2009
Sold by
Pantleo Dennis
Bought by
Pantleo Dennis R and Neidhart Cheryl L
Home Financials for this Owner
Home Financials are based on the most recent Mortgage that was taken out on this home.
Original Mortgage
$107,100
Interest Rate
5.18%
Mortgage Type
New Conventional
Purchase Details
Closed on
Jan 7, 2008
Sold by
Pantleo Dennis
Bought by
Pantleo Dennis R and Neidhart Cheryl L
Purchase Details
Closed on
Mar 15, 1996
Sold by
Ott Donald R and Ott Doris D
Bought by
Pantleo Dennis
Home Financials for this Owner
Home Financials are based on the most recent Mortgage that was taken out on this home.
Original Mortgage
$101,850
Interest Rate
7.41%
Mortgage Type
New Conventional
Create a Home Valuation Report for This Property
The Home Valuation Report is an in-depth analysis detailing your home's value as well as a comparison with similar homes in the area
Home Values in the Area
Average Home Value in this Area
Purchase History
| Date | Buyer | Sale Price | Title Company |
|---|---|---|---|
| 16689 West Llc | $526,000 | Great American Ttl Agcy Inc | |
| Pantleo Dennis R | -- | Pioneer Title Agency Inc | |
| Pantleo Dennis | -- | Pioneer Title Agency Inc | |
| Pantleo Dennis R | -- | None Available | |
| Pantleo Dennis | $105,000 | First American Title |
Source: Public Records
Mortgage History
| Date | Status | Borrower | Loan Amount |
|---|---|---|---|
| Previous Owner | Pantleo Dennis | $107,100 | |
| Previous Owner | Pantleo Dennis | $101,850 |
Source: Public Records
Tax History Compared to Growth
Tax History
| Year | Tax Paid | Tax Assessment Tax Assessment Total Assessment is a certain percentage of the fair market value that is determined by local assessors to be the total taxable value of land and additions on the property. | Land | Improvement |
|---|---|---|---|---|
| 2025 | $2,103 | $23,818 | -- | -- |
| 2024 | $2,321 | $22,684 | -- | -- |
| 2023 | $2,321 | $40,710 | $8,140 | $32,570 |
| 2022 | $2,298 | $31,310 | $6,260 | $25,050 |
| 2021 | $1,977 | $29,260 | $5,850 | $23,410 |
| 2020 | $1,910 | $27,810 | $5,560 | $22,250 |
| 2019 | $1,918 | $25,470 | $5,090 | $20,380 |
| 2018 | $1,849 | $23,920 | $4,780 | $19,140 |
| 2017 | $1,765 | $21,910 | $4,380 | $17,530 |
| 2016 | $1,737 | $21,160 | $4,230 | $16,930 |
| 2015 | $1,612 | $20,460 | $4,090 | $16,370 |
Source: Public Records
Map
Nearby Homes
- 13036 N 36th St
- 3633 E Sweetwater Ave
- 3508 E Larkspur Dr
- 3708 E Joan de Arc Ave
- 13250 N 38th St
- 13629 N 36th St
- 3455 E Sharon Dr
- 3914 E Andorra Dr
- 3478 E Sharon Dr
- 13608 N 33rd St
- 3542 E Sharon Dr
- 13642 N 38th St
- 13208 N 31st Way
- 13224 N 31st Way
- 3733 E Charter Oak Rd
- 4012 E Captain Dreyfus Ave
- 3302 E Thunderbird Rd
- 4025 E Surrey Ave
- 3620 E Ludlow Dr
- 3545 E Friess Dr
- 13208 N 36th St
- 13218 N 36th St
- 3601 E Surrey Ave
- 3602 E Surrey Ave
- 3602 E Captain Dreyfus Ave
- 3607 E Surrey Ave
- 13224 N 36th St
- 3608 E Surrey Ave
- 3601 E Pershing Ave
- 3608 E Captain Dreyfus Ave
- 3607 E Pershing Ave
- 3613 E Surrey Ave
- 3614 E Surrey Ave
- 13230 N 36th St
- 3601 E Captain Dreyfus Ave
- 3614 E Captain Dreyfus Ave
- 3613 E Pershing Ave
- 3533 E Willow Ave
- 3607 E Captain Dreyfus Ave
- 3621 E Surrey Ave