
Seller's Agent in 2025
Ashley Wise
Tribeca NW Real Estate
(360) 292-0985
6 in this area
213 Total Sales
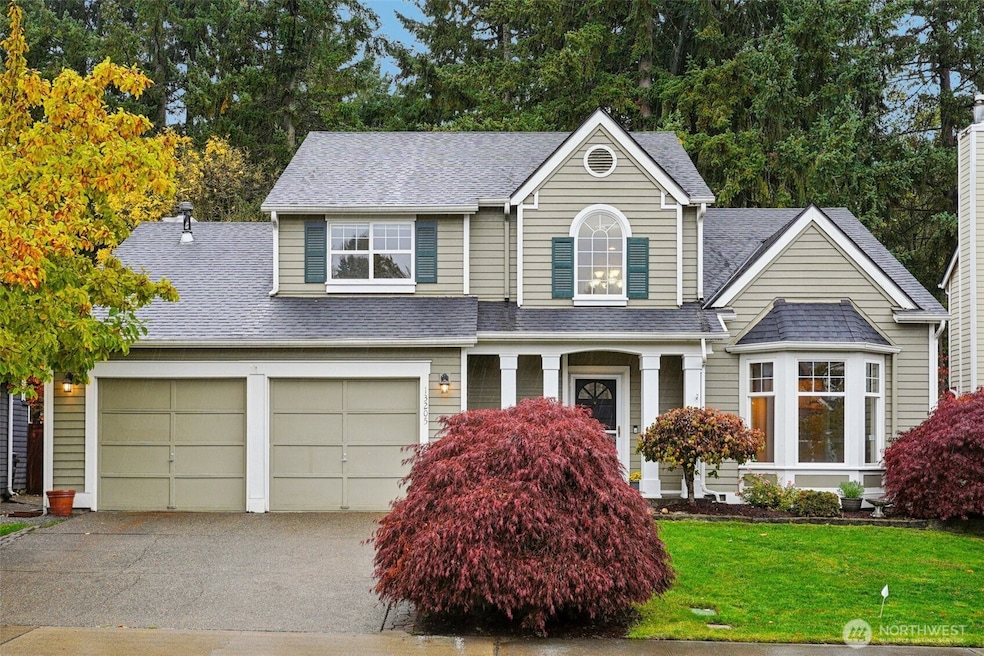
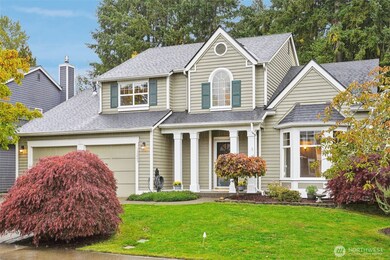
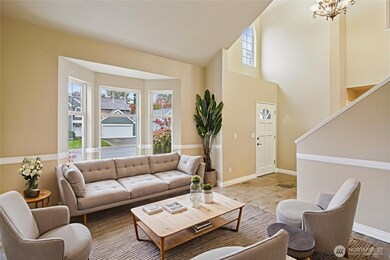
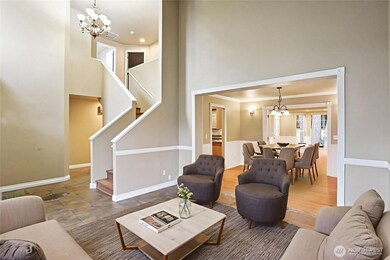
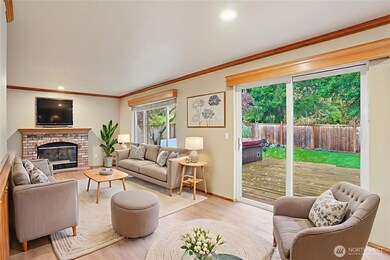
Welcome to this wonderfully updated 3 bed, 2.5 bath home in the highly desirable Sunrise Community! The spacious main level features a bright, open-concept kitchen w/large island, dining area, & new appliances that stay! The kitchen flows seamlessly into an inviting living room w/ a cozy gas fireplace. Enjoy fresh interior paint & new flooring throughout. Upstairs, the large primary suite includes a walk-in closet & en-suite. Two additional generous bedrooms, a full bath, & plenty of storage complete the upper level. Step outside to your private, fully fenced backyard w/ a large deck, hot tub, and new landscaping. Additional updates include a new architectural composition roof. This sought-after community is a beautiful place to call home!
Source: Northwest Multiple Listing Service (NWMLS)
MLS#: 2449100
| Date | Type | Sale Price | Title Company |
|---|---|---|---|
| Interfamily Deed Transfer | -- | None Available | |
| Interfamily Deed Transfer | -- | None Available | |
| Warranty Deed | $162,500 | Commonwealth Title Company | |
| Warranty Deed | -- | -- |
| Date | Status | Loan Amount | Loan Type |
|---|---|---|---|
| Closed | $121,850 | Balloon | |
| Previous Owner | $144,300 | No Value Available | |
| Closed | $24,375 | No Value Available |
| Date | Event | Price | List to Sale | Price per Sq Ft |
|---|---|---|---|---|
| 12/05/2025 12/05/25 | Sold | $560,000 | +1.8% | $252 / Sq Ft |
| 11/05/2025 11/05/25 | Pending | -- | -- | -- |
| 10/29/2025 10/29/25 | For Sale | $549,950 | -- | $248 / Sq Ft |
| Year | Tax Paid | Tax Assessment Tax Assessment Total Assessment is a certain percentage of the fair market value that is determined by local assessors to be the total taxable value of land and additions on the property. | Land | Improvement |
|---|---|---|---|---|
| 2025 | $5,238 | $530,500 | $173,400 | $357,100 |
| 2024 | $5,238 | $509,200 | $165,300 | $343,900 |
| 2023 | $5,238 | $495,100 | $161,800 | $333,300 |
| 2022 | $4,896 | $496,500 | $169,900 | $326,600 |
| 2021 | $4,670 | $359,300 | $120,000 | $239,300 |
| 2019 | $4,248 | $329,600 | $104,300 | $225,300 |
| 2018 | $4,317 | $326,100 | $98,500 | $227,600 |
| 2017 | $4,020 | $296,400 | $88,700 | $207,700 |
| 2016 | $3,717 | $243,500 | $70,100 | $173,400 |
| 2014 | $3,293 | $231,400 | $59,000 | $172,400 |
| 2013 | $3,293 | $208,600 | $51,400 | $157,200 |
Seller's Agent in 2025
Ashley Wise
Tribeca NW Real Estate
(360) 292-0985
6 in this area
213 Total Sales
Seller Co-Listing Agent in 2025
Emily Butts
Tribeca NW Real Estate
(206) 300-7381
1 in this area
25 Total Sales
Buyer's Agent in 2025
Gervon Simon
COMPASS
(206) 601-4775
11 in this area
287 Total Sales
Source: Northwest Multiple Listing Service (NWMLS)
MLS Number: 2449100
APN: 602100-0190
Disclaimer: Certain information contained herein is derived from information provided by parties other than Homes.com. All information provided is deemed reliable, but is not guaranteed to be accurate and should be independently verified.
![]() All data is obtained from various sources and may not have been verified by broker or MLS GRID. Supplied Open House Information is subject to change without notice. All information should be independently reviewed and verified for accuracy. Properties may or may not be listed by the office/agent presenting the information. Listing information is provided by the Northwest Multiple Listing Service (NWMLS). Property information is based on available data that may include MLS information, county records, and other sources. Listings marked with the 3 tree icon and provided by NWMLS. All properties are subject to prior sale or withdrawal. IDX information is provided exclusively for consumers’ personal noncommercial use, that it may not be used for any purpose other than to identify prospective properties consumers may be interested in purchasing, that the data is deemed reliable but is not guaranteed by MLS GRID. ©2025 NWMLS.
All data is obtained from various sources and may not have been verified by broker or MLS GRID. Supplied Open House Information is subject to change without notice. All information should be independently reviewed and verified for accuracy. Properties may or may not be listed by the office/agent presenting the information. Listing information is provided by the Northwest Multiple Listing Service (NWMLS). Property information is based on available data that may include MLS information, county records, and other sources. Listings marked with the 3 tree icon and provided by NWMLS. All properties are subject to prior sale or withdrawal. IDX information is provided exclusively for consumers’ personal noncommercial use, that it may not be used for any purpose other than to identify prospective properties consumers may be interested in purchasing, that the data is deemed reliable but is not guaranteed by MLS GRID. ©2025 NWMLS.
Based on information submitted to the MLS GRID