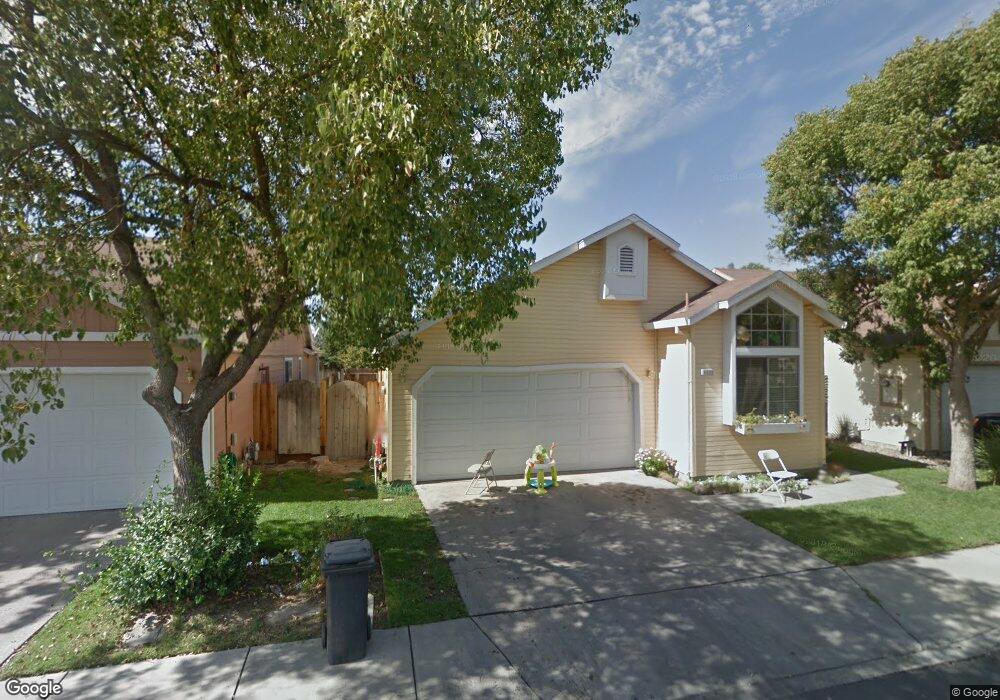
1321 Austin David Way Turlock, CA 95380
Estimated Value: $333,000 - $383,624
3
Beds
2
Baths
1,052
Sq Ft
$340/Sq Ft
Est. Value
About This Home
This home is located at 1321 Austin David Way, Turlock, CA 95380 and is currently estimated at $357,906, approximately $340 per square foot. 1321 Austin David Way is a home located in Stanislaus County with nearby schools including Crowell Elementary School, Marvin A. Dutcher Middle School, and Turlock Junior High School.
Ownership History
Date
Name
Owned For
Owner Type
Purchase Details
Closed on
Oct 1, 2010
Sold by
Volk Steven J and Volk Mary B
Bought by
Bassi Lakwinder S and Bassi Sukhjinder K
Current Estimated Value
Home Financials for this Owner
Home Financials are based on the most recent Mortgage that was taken out on this home.
Original Mortgage
$92,000
Outstanding Balance
$60,193
Interest Rate
4.26%
Mortgage Type
New Conventional
Estimated Equity
$297,713
Purchase Details
Closed on
Apr 14, 2005
Sold by
Shaw James D and Shaw Kym L
Bought by
Volk Steven J and Volk Mary B
Home Financials for this Owner
Home Financials are based on the most recent Mortgage that was taken out on this home.
Original Mortgage
$175,000
Interest Rate
5.92%
Mortgage Type
Fannie Mae Freddie Mac
Purchase Details
Closed on
Oct 22, 1996
Sold by
Pearson Doris E and Pearson Doris E Trust
Bought by
Shaw James D and Shaw Kym L
Home Financials for this Owner
Home Financials are based on the most recent Mortgage that was taken out on this home.
Original Mortgage
$79,448
Interest Rate
8.11%
Mortgage Type
FHA
Create a Home Valuation Report for This Property
The Home Valuation Report is an in-depth analysis detailing your home's value as well as a comparison with similar homes in the area
Purchase History
| Date | Buyer | Sale Price | Title Company |
|---|---|---|---|
| Bassi Lakwinder S | $115,000 | First American Title Company | |
| Volk Steven J | $272,000 | First American Title Co | |
| Shaw James D | $80,000 | Chicago Title Co |
Source: Public Records
Mortgage History
| Date | Status | Borrower | Loan Amount |
|---|---|---|---|
| Open | Bassi Lakwinder S | $92,000 | |
| Previous Owner | Volk Steven J | $175,000 | |
| Previous Owner | Shaw James D | $79,448 |
Source: Public Records
Tax History
| Year | Tax Paid | Tax Assessment Tax Assessment Total Assessment is a certain percentage of the fair market value that is determined by local assessors to be the total taxable value of land and additions on the property. | Land | Improvement |
|---|---|---|---|---|
| 2025 | $1,583 | $147,323 | $57,648 | $89,675 |
| 2024 | $1,554 | $144,435 | $56,518 | $87,917 |
| 2023 | $1,552 | $141,604 | $55,410 | $86,194 |
| 2022 | $1,532 | $138,828 | $54,324 | $84,504 |
| 2021 | $1,510 | $136,107 | $53,259 | $82,848 |
| 2020 | $1,499 | $134,712 | $52,713 | $81,999 |
| 2019 | $1,474 | $132,072 | $51,680 | $80,392 |
| 2018 | $1,473 | $129,483 | $50,667 | $78,816 |
| 2017 | $1,439 | $126,945 | $49,674 | $77,271 |
| 2016 | $1,344 | $124,456 | $48,700 | $75,756 |
| 2015 | $1,332 | $122,588 | $47,969 | $74,619 |
| 2014 | $1,319 | $120,188 | $47,030 | $73,158 |
Source: Public Records
Map
Nearby Homes
- 153 Almond Ave
- 425 20th Century Blvd Unit E-1
- 425 20th Century Blvd Unit A13
- 1366 Geer Rd
- 1733 Geer Rd
- 100 Pedras Rd
- 512 N Palm St
- 1880 Donnelly Park Dr
- 494 Wayside Dr
- 1227 Windsor Ct
- 345 Riviera Way
- 900 W Canal Dr Unit 100
- 900 W Canal Dr Unit 114
- 2140 Georgia Way
- 311 Mitchell Ave
- 309 N Center St
- 685 Park St
- 2140 Rochelle Ave
- 2241 Rochelle Ave
- 861 Wayside Dr
- 1341 Austin David Way
- 1301 Austin David Way
- 1361 Austin David Way
- 1281 Austin David Way
- 1320 Austin David Way
- 1340 Austin David Way
- 1300 Austin David Way
- 305 Allen Way
- 1261 Austin David Way
- 1381 Austin David Way
- 1360 Austin David Way
- 332 Allen Way
- 1280 Austin David Way
- 304 Sue St
- 310 Allen Way
- 1380 Austin David Way
- 1260 Austin David Way
- 152 20th Century Blvd
- 152 20th Century Blvd
- 152 20th Century Blvd
Your Personal Tour Guide
Ask me questions while you tour the home.