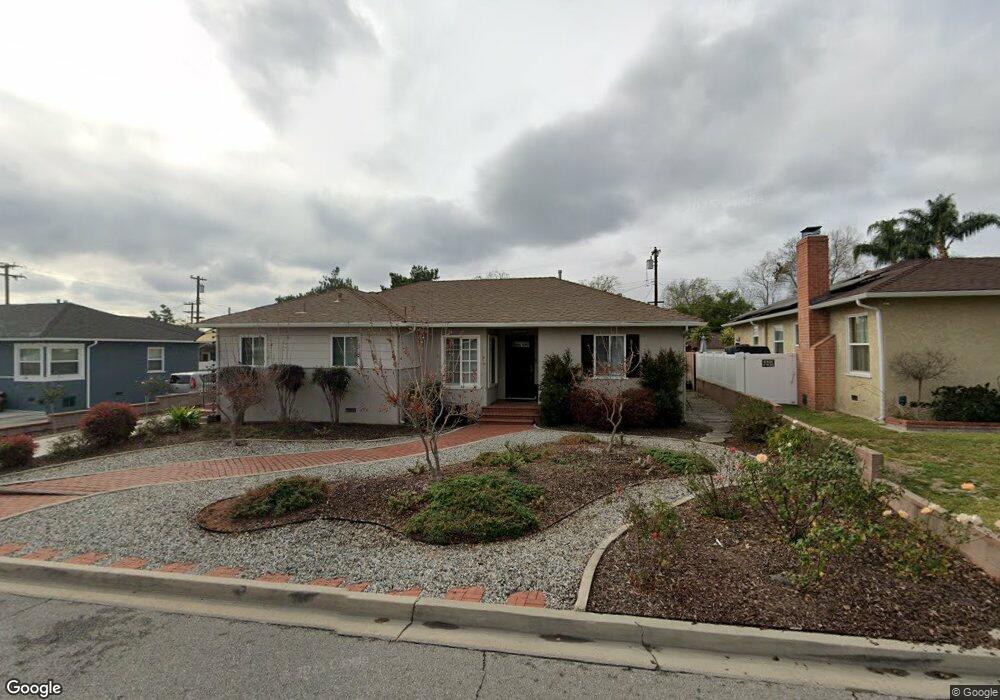
1321 Carpenter St La Habra, CA 90631
Estimated Value: $835,542 - $1,019,000
3
Beds
2
Baths
1,428
Sq Ft
$659/Sq Ft
Est. Value
About This Home
This home is located at 1321 Carpenter St, La Habra, CA 90631 and is currently estimated at $940,886, approximately $658 per square foot. 1321 Carpenter St is a home located in Orange County with nearby schools including Macy Elementary School, Rancho-Starbuck Intermediate School, and La Habra High School.
Ownership History
Date
Name
Owned For
Owner Type
Purchase Details
Closed on
Jun 13, 2015
Sold by
Woodruff Russell Lee
Bought by
Woodruff Russell Lee and Woodruff Candace
Current Estimated Value
Purchase Details
Closed on
Jun 2, 2007
Sold by
Woodruff Shirley C and Woodruff Russell Lee
Bought by
Woodruff Shirley C and Shirley C Woodruff Trust
Purchase Details
Closed on
May 7, 2004
Sold by
Woodruff Shirley C
Bought by
Woodruff Shirley C and Woodruff Russell Lee
Purchase Details
Closed on
May 16, 2003
Sold by
Wood James P and Wood Jennifer J
Bought by
Kunkel Paul D and Shute Karen S
Home Financials for this Owner
Home Financials are based on the most recent Mortgage that was taken out on this home.
Original Mortgage
$249,520
Outstanding Balance
$100,202
Interest Rate
4.75%
Mortgage Type
Purchase Money Mortgage
Estimated Equity
$840,684
Purchase Details
Closed on
Jan 26, 2000
Sold by
Woodruff Shirley C
Bought by
Woodruff Shirley C and Shirley C Woodruff Trust
Create a Home Valuation Report for This Property
The Home Valuation Report is an in-depth analysis detailing your home's value as well as a comparison with similar homes in the area
Home Values in the Area
Average Home Value in this Area
Purchase History
| Date | Buyer | Sale Price | Title Company |
|---|---|---|---|
| Woodruff Russell Lee | -- | None Available | |
| Woodruff Shirley C | -- | None Available | |
| Woodruff Shirley C | -- | -- | |
| Kunkel Paul D | $312,000 | First American Title Co | |
| Woodruff Shirley C | -- | -- |
Source: Public Records
Mortgage History
| Date | Status | Borrower | Loan Amount |
|---|---|---|---|
| Open | Kunkel Paul D | $249,520 | |
| Closed | Kunkel Paul D | $46,750 |
Source: Public Records
Tax History Compared to Growth
Tax History
| Year | Tax Paid | Tax Assessment Tax Assessment Total Assessment is a certain percentage of the fair market value that is determined by local assessors to be the total taxable value of land and additions on the property. | Land | Improvement |
|---|---|---|---|---|
| 2025 | $1,207 | $84,657 | $28,164 | $56,493 |
| 2024 | $1,207 | $82,998 | $27,612 | $55,386 |
| 2023 | $1,174 | $81,371 | $27,071 | $54,300 |
| 2022 | $1,154 | $79,776 | $26,540 | $53,236 |
| 2021 | $1,132 | $78,212 | $26,019 | $52,193 |
| 2020 | $1,126 | $77,411 | $25,753 | $51,658 |
| 2019 | $1,106 | $75,894 | $25,248 | $50,646 |
| 2018 | $1,070 | $74,406 | $24,753 | $49,653 |
| 2017 | $915 | $60,234 | $24,267 | $35,967 |
| 2016 | $3,602 | $59,053 | $23,791 | $35,262 |
| 2015 | $949 | $58,166 | $23,433 | $34,733 |
| 2014 | $850 | $57,027 | $22,974 | $34,053 |
Source: Public Records
Map
Nearby Homes
- 2401 Canfield Dr
- 2311 Canfield Dr
- 10303 Pounds Ave
- 9331 Mikinda Ave
- 16635 Monte Oro Dr
- 16540 Whittier Blvd
- 9422 Canfield Dr
- 16875 Sausalito Dr
- 9915 Corella Ave
- 1436 La Riata Dr
- 10418 Bogardus Ave Unit 4
- 1525 Bonnie Jean Ln
- 2611 Gregory Ln
- 1000 Dolores St
- 0 Cloister Dr Unit OC24116252
- 2100 Gregory Ln
- 16046 Gables Loop
- 16164 Leffco Rd
- 15975 Graceldo Ln
- 16121 Lisco St
- 1331 Carpenter St
- 1311 Carpenter St
- 1320 Valley Home Ave
- 1330 Valley Home Ave
- 1310 Valley Home Ave
- 1401 Carpenter St
- 1301 Carpenter St
- 1320 Carpenter St
- 1310 Carpenter St
- 1330 Carpenter St
- 1400 Valley Home Ave
- 1300 Valley Home Ave
- 1411 Carpenter St
- 1300 Carpenter St
- 1400 Carpenter St
- 1410 Valley Home Ave
- 1321 Roanoke St
- 1410 Carpenter St
- 1331 Roanoke St
- 1311 Roanoke St