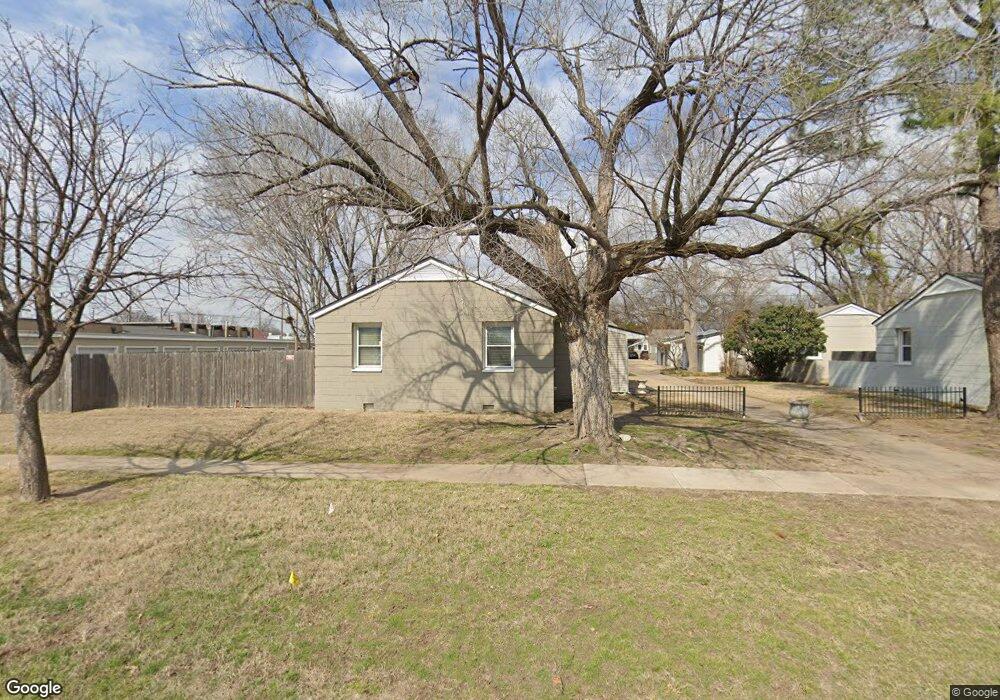
1321 E 39th St Unit C Tulsa, OK 74105
Brookside NeighborhoodEstimated Value: $132,000 - $172,246
Studio
1
Bath
761
Sq Ft
$198/Sq Ft
Est. Value
About This Home
This home is located at 1321 E 39th St Unit C, Tulsa, OK 74105 and is currently estimated at $150,812, approximately $198 per square foot. 1321 E 39th St Unit C is a home located in Tulsa County with nearby schools including Eliot Elementary School, Edison Preparatory School, and Thomas Edison Preparatory High School.
Ownership History
Date
Name
Owned For
Owner Type
Purchase Details
Closed on
Jan 14, 2021
Sold by
Fairbrothers Noel Suzanne
Bought by
Hardison Tracy Elizabeth and Hardison Michael
Current Estimated Value
Purchase Details
Closed on
Apr 21, 2017
Sold by
Fairbrothers Noel Suzanne and Kearns Richard Paul
Bought by
Fairbrothers Noel Suzanne and Kearns Richard Paul
Purchase Details
Closed on
Oct 20, 2010
Sold by
Baker Bliss A and Lowe Craig
Bought by
Fairbrothers Noel Suzanne
Home Financials for this Owner
Home Financials are based on the most recent Mortgage that was taken out on this home.
Original Mortgage
$72,522
Interest Rate
4.5%
Mortgage Type
FHA
Purchase Details
Closed on
Aug 19, 1998
Sold by
Bacher Michael A and Bacher Julia R
Bought by
Bacher Michael A and Bacher Julia R
Purchase Details
Closed on
Mar 1, 1997
Sold by
Hart Martin G
Bought by
Baker Bliss A
Create a Home Valuation Report for This Property
The Home Valuation Report is an in-depth analysis detailing your home's value as well as a comparison with similar homes in the area
Home Values in the Area
Average Home Value in this Area
Purchase History
| Date | Buyer | Sale Price | Title Company |
|---|---|---|---|
| Hardison Tracy Elizabeth | $88,500 | Titan Title & Closing Llc | |
| Fairbrothers Noel Suzanne | -- | None Available | |
| Fairbrothers Noel Suzanne | $73,500 | Frisco Title Corporation | |
| Bacher Michael A | -- | -- | |
| Baker Bliss A | $35,000 | -- |
Source: Public Records
Mortgage History
| Date | Status | Borrower | Loan Amount |
|---|---|---|---|
| Previous Owner | Fairbrothers Noel Suzanne | $72,522 |
Source: Public Records
Tax History
| Year | Tax Paid | Tax Assessment Tax Assessment Total Assessment is a certain percentage of the fair market value that is determined by local assessors to be the total taxable value of land and additions on the property. | Land | Improvement |
|---|---|---|---|---|
| 2025 | $1,370 | $10,222 | $447 | $9,775 |
| 2024 | $1,235 | $9,735 | $748 | $8,987 |
| 2023 | $1,235 | $9,735 | $748 | $8,987 |
| 2022 | $1,298 | $9,735 | $748 | $8,987 |
| 2021 | $899 | $6,810 | $652 | $6,158 |
| 2020 | $887 | $6,810 | $652 | $6,158 |
| 2019 | $933 | $6,810 | $652 | $6,158 |
| 2018 | $935 | $6,810 | $652 | $6,158 |
| 2017 | $934 | $7,810 | $748 | $7,062 |
| 2016 | $914 | $7,810 | $748 | $7,062 |
| 2015 | $953 | $8,085 | $748 | $7,337 |
| 2014 | $944 | $8,085 | $748 | $7,337 |
Source: Public Records
Map
Nearby Homes
- 1324 E 38th St Unit 1324
- 1320 E 38th St Unit 1320
- 1340 E 38th St Unit D
- 1437 E 39th St Unit A
- 1437 E 38th Place Unit A
- 1433 E 38th St
- 4133 S Norfolk Ave
- 3921 S Madison Ave
- 1009 E 38th St
- 3947 S Madison Ave
- 3758 S Madison Ave Unit 5
- 3704 S Madison Ave Unit 3704
- 4238 S Owasso Ave
- 4149 S St Louis Ave
- 4123 S Trenton Ave
- 4181 S Rockford Place
- 4152 S Trenton Ave
- 3920 S Utica Ave
- 3779 Riverside Dr Unit 3779
- 1104 E 35th Place
- 1321 E 39th St Unit 1321
- 1321 E 39th St Unit A
- 1321 E 39th St Unit B
- 1324 E 38th Place Unit C
- 1324 E 38th Place Unit B
- 1324 E 38th Place Unit 1324
- 1324 E 38th Place Unit D
- 1324 E 38th Place Unit A
- 1329 E 39th St Unit C
- 1329 E 39th St Unit 1329
- 1329 E 39th St Unit 1329
- 1329 E 39th St Unit 1329D
- 1329 E 39th St Unit B
- 1329 E 39th St
- 1329 E 39th St Unit A
- 1320 E 38th Place Unit C
- 1320 E 38th Place Unit 1320
- 1318 E 38th Place Unit 1318
- 1320 E 38th Place Unit D
- 1318 E 38th Place Unit A & B
Your Personal Tour Guide
Ask me questions while you tour the home.