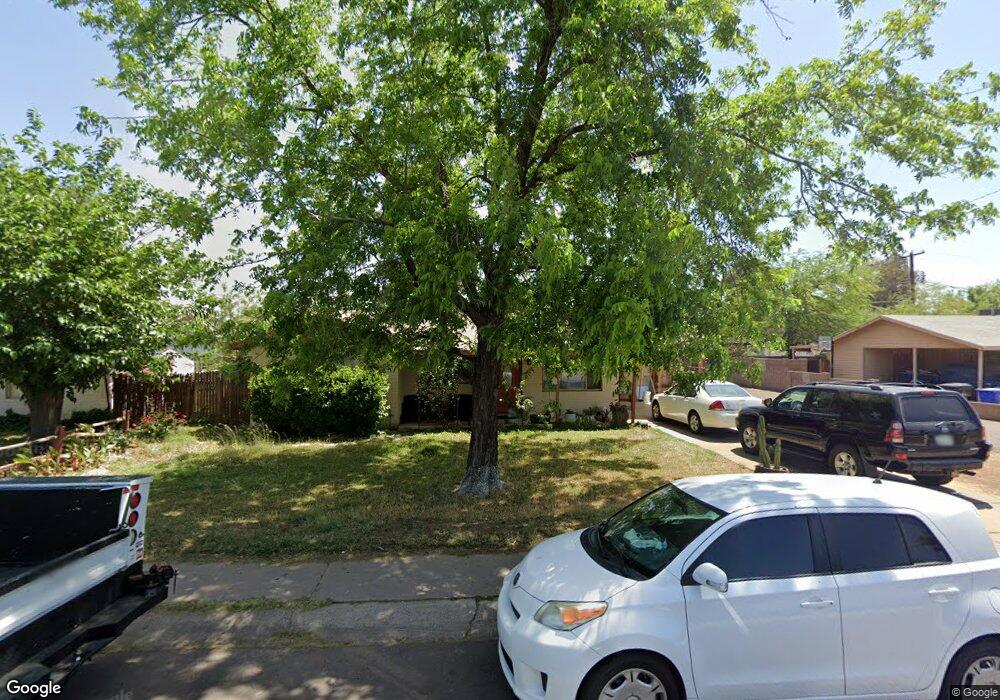
1321 E Lemon St Tempe, AZ 85281
Downtown Tempe NeighborhoodEstimated Value: $402,074 - $497,000
Studio
2
Baths
1,490
Sq Ft
$303/Sq Ft
Est. Value
About This Home
This home is located at 1321 E Lemon St, Tempe, AZ 85281 and is currently estimated at $450,769, approximately $302 per square foot. 1321 E Lemon St is a home located in Maricopa County with nearby schools including Laird Elementary School, McClintock High School, and New School for the Arts & Academics.
Ownership History
Date
Name
Owned For
Owner Type
Purchase Details
Closed on
Dec 24, 2019
Sold by
Rockas Margaret Maclean and The Thomas F Duffy Trust
Bought by
Emery Carley and Zinnel Michell
Current Estimated Value
Home Financials for this Owner
Home Financials are based on the most recent Mortgage that was taken out on this home.
Original Mortgage
$247,350
Outstanding Balance
$218,075
Interest Rate
3.6%
Mortgage Type
New Conventional
Estimated Equity
$232,694
Purchase Details
Closed on
Mar 20, 2014
Sold by
Duffy Thomas F
Bought by
Duffy Thomas F and The Thomas F Duffy Trust
Purchase Details
Closed on
Apr 4, 2006
Sold by
Maclean Mary Ann
Bought by
Duffy Thomas F
Purchase Details
Closed on
Jul 16, 2001
Sold by
Mathews Lenice A
Bought by
Mathews Lenice A and The Ralph D & Lenice A Mathews Living Tr
Purchase Details
Closed on
May 14, 1996
Sold by
Mathews Lenice A and Duffy Tom F
Bought by
The Lenice A Mathews Revocable Living Tr and Mathews Lenice A
Create a Home Valuation Report for This Property
The Home Valuation Report is an in-depth analysis detailing your home's value as well as a comparison with similar homes in the area
Home Values in the Area
Average Home Value in this Area
Purchase History
| Date | Buyer | Sale Price | Title Company |
|---|---|---|---|
| Emery Carley | $255,000 | Fidelity Natl Ttl Agcy Inc | |
| Duffy Thomas F | -- | None Available | |
| Duffy Thomas F | -- | None Available | |
| Mathews Lenice A | -- | -- | |
| The Lenice A Mathews Revocable Living Tr | -- | -- |
Source: Public Records
Mortgage History
| Date | Status | Borrower | Loan Amount |
|---|---|---|---|
| Open | Emery Carley | $247,350 |
Source: Public Records
Tax History
| Year | Tax Paid | Tax Assessment Tax Assessment Total Assessment is a certain percentage of the fair market value that is determined by local assessors to be the total taxable value of land and additions on the property. | Land | Improvement |
|---|---|---|---|---|
| 2025 | $1,111 | $9,266 | -- | -- |
| 2024 | $1,773 | $17,649 | -- | -- |
| 2023 | $1,773 | $34,420 | $6,880 | $27,540 |
| 2022 | $1,693 | $25,520 | $5,100 | $20,420 |
| 2021 | $1,726 | $23,750 | $4,750 | $19,000 |
| 2020 | $1,669 | $22,380 | $4,470 | $17,910 |
| 2019 | $1,637 | $20,420 | $4,080 | $16,340 |
| 2018 | $1,593 | $19,720 | $3,940 | $15,780 |
| 2017 | $1,543 | $17,610 | $3,520 | $14,090 |
| 2016 | $1,536 | $15,270 | $3,050 | $12,220 |
| 2015 | $1,485 | $14,430 | $2,880 | $11,550 |
Source: Public Records
Map
Nearby Homes
- 1314 E Orange St
- 1036 S Mariana St Unit 5
- 1002 S Mariana St
- 1215 E Lemon St Unit 208
- 1622 E 12th St
- 1229 E Spence Ave
- 1615 E Hudson Dr
- 1418 S Newberry Ln
- 1111 E University Dr Unit 201
- 1111 E University Dr Unit 103
- 1111 E University Dr Unit 102
- 906 S Acapulco Ln Unit A
- 1808 E Center Ln Unit D
- 1433 S Rita Ln
- 1827 E Kirkland Ln Unit D
- 917 S Acapulco Ln Unit C
- 1831 E Kirkland Ln Unit B
- 924 S Casitas Dr Unit C
- 1491 S Rita Ln
- 834 S Casitas Dr Unit B
- 1325 E Lemon St
- 1317 E Lemon St
- 1320 E Hall St
- 1329 E Lemon St
- 1324 E Hall St
- 1315 E Lemon St
- 1324 E Lemon St
- 1320 E Lemon St
- 1328 E Hall St
- 1328 E Lemon St
- 1333 E Lemon St
- 1316 E Lemon St
- 1332 E Lemon St
- 1309 E Lemon St
- 1332 E Hall St
- 1312 E Lemon St
- 1336 E Lemon St
- 1337 E Lemon St
- 1321 E Don Carlos Ave
- 1325 E Don Carlos Ave
Your Personal Tour Guide
Ask me questions while you tour the home.