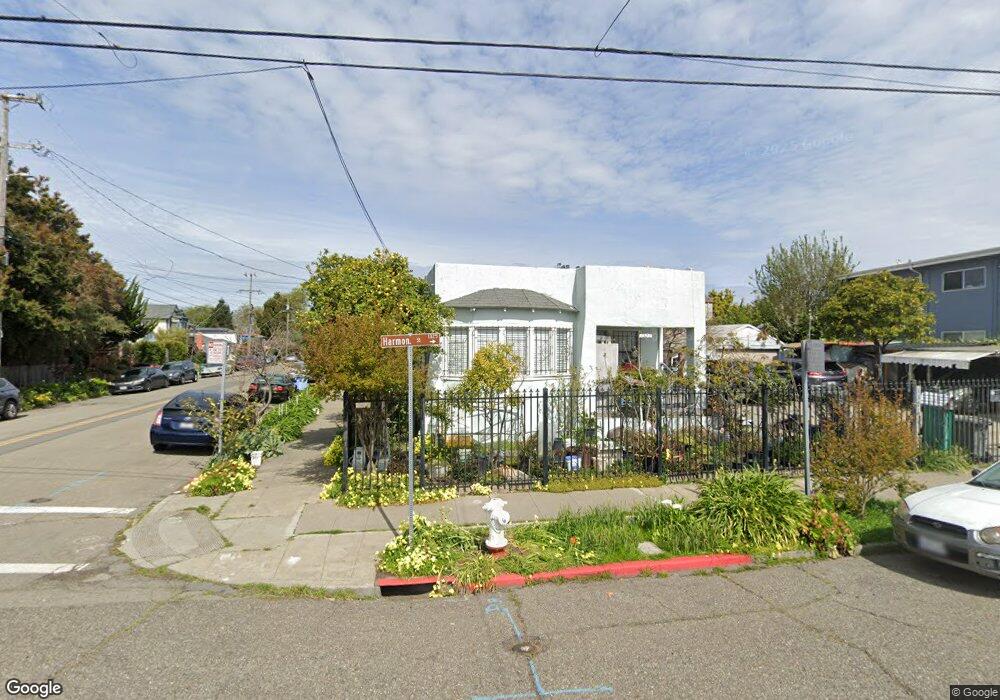
1321 Harmon St Berkeley, CA 94702
West Berkeley NeighborhoodEstimated Value: $771,000 - $1,132,000
2
Beds
1
Bath
970
Sq Ft
$991/Sq Ft
Est. Value
About This Home
This home is located at 1321 Harmon St, Berkeley, CA 94702 and is currently estimated at $961,037, approximately $990 per square foot. 1321 Harmon St is a home located in Alameda County with nearby schools including Malcolm X Elementary School, Washington Elementary School, and Oxford Elementary School.
Ownership History
Date
Name
Owned For
Owner Type
Purchase Details
Closed on
Nov 25, 2020
Sold by
Sieu Alex and Bun Nasin
Bought by
Sieu Alex and Bun Nasin
Current Estimated Value
Purchase Details
Closed on
Dec 26, 2002
Sold by
Kanya Sieu Alex and Kanya Sieu Ley
Bought by
Nasin Sieu Alex and Nasin Bun
Home Financials for this Owner
Home Financials are based on the most recent Mortgage that was taken out on this home.
Original Mortgage
$123,000
Interest Rate
6.06%
Create a Home Valuation Report for This Property
The Home Valuation Report is an in-depth analysis detailing your home's value as well as a comparison with similar homes in the area
Home Values in the Area
Average Home Value in this Area
Purchase History
| Date | Buyer | Sale Price | Title Company |
|---|---|---|---|
| Sieu Alex | -- | None Available | |
| Nasin Sieu Alex | -- | Alliance Title Company |
Source: Public Records
Mortgage History
| Date | Status | Borrower | Loan Amount |
|---|---|---|---|
| Closed | Nasin Sieu Alex | $123,000 |
Source: Public Records
Tax History
| Year | Tax Paid | Tax Assessment Tax Assessment Total Assessment is a certain percentage of the fair market value that is determined by local assessors to be the total taxable value of land and additions on the property. | Land | Improvement |
|---|---|---|---|---|
| 2025 | $6,502 | $357,107 | $108,470 | $255,637 |
| 2024 | $6,502 | $349,969 | $106,343 | $250,626 |
| 2023 | $6,351 | $349,972 | $104,259 | $245,713 |
| 2022 | $6,211 | $336,111 | $102,215 | $240,896 |
| 2021 | $6,205 | $329,385 | $100,211 | $236,174 |
| 2020 | $5,835 | $332,938 | $99,184 | $233,754 |
| 2019 | $5,560 | $326,411 | $97,240 | $229,171 |
| 2018 | $5,450 | $320,013 | $95,334 | $224,679 |
| 2017 | $5,233 | $313,740 | $93,465 | $220,275 |
| 2016 | $5,029 | $307,590 | $91,633 | $215,957 |
| 2015 | $4,955 | $302,971 | $90,257 | $212,714 |
| 2014 | $4,857 | $297,037 | $88,489 | $208,548 |
Source: Public Records
Map
Nearby Homes
- 1046 Alcatraz Ave
- 3224 Sacramento St
- 968 62nd St
- 3101 Sacramento St
- 3138 California St
- 1507 Prince St
- 1080 67th St
- 6500 San Pablo Ave
- 3032 Mabel St
- 3114 California St
- 6465 San Pablo Ave Unit 306
- 6501 San Pablo Ave Unit 410
- 1314 Ashby Ave
- 3000 Acton St
- 1076 61st St
- 1124 63rd St
- 1150 Ocean Ave
- 1164 Ocean Ave
- 1156 64th St
- 1538 Ashby Ave
Your Personal Tour Guide
Ask me questions while you tour the home.