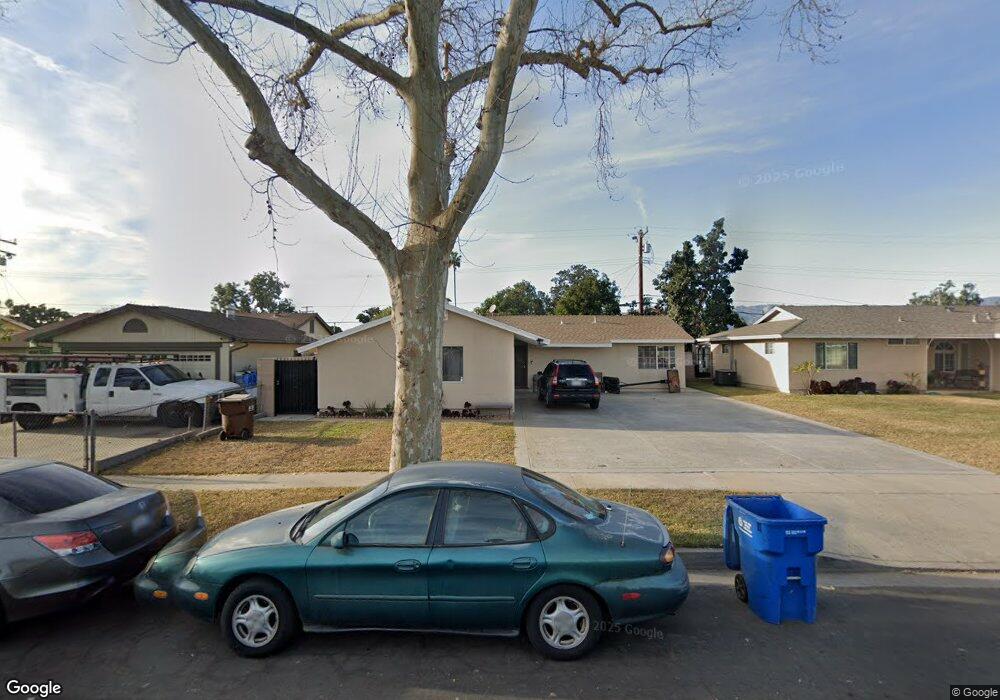
1321 N Siesta Ave La Puente, CA 91746
West Puente Valley NeighborhoodEstimated Value: $706,369 - $772,000
3
Beds
2
Baths
1,141
Sq Ft
$655/Sq Ft
Est. Value
About This Home
This home is located at 1321 N Siesta Ave, La Puente, CA 91746 and is currently estimated at $747,592, approximately $655 per square foot. 1321 N Siesta Ave is a home located in Los Angeles County with nearby schools including Sunkist Elementary School, Torch Middle School, and Bassett Senior High School.
Ownership History
Date
Name
Owned For
Owner Type
Purchase Details
Closed on
Sep 25, 2025
Sold by
Avila Pioquinto and Avila Alicia
Bought by
Pioquinto Avila And Alicia Avila Revocable Li and Avila
Current Estimated Value
Purchase Details
Closed on
Apr 9, 2004
Sold by
Avila Nicolas
Bought by
Avila Pioquinto and Avila Alicia
Home Financials for this Owner
Home Financials are based on the most recent Mortgage that was taken out on this home.
Original Mortgage
$162,000
Interest Rate
5.57%
Mortgage Type
New Conventional
Purchase Details
Closed on
Dec 12, 1998
Sold by
Homeowners Equity Corp
Bought by
Avila Nicolas and Avila Pioquinto
Home Financials for this Owner
Home Financials are based on the most recent Mortgage that was taken out on this home.
Original Mortgage
$139,020
Interest Rate
6.63%
Mortgage Type
FHA
Purchase Details
Closed on
May 19, 1998
Sold by
Schoonenberg Anthony J
Bought by
Homeowners Equity Corp
Create a Home Valuation Report for This Property
The Home Valuation Report is an in-depth analysis detailing your home's value as well as a comparison with similar homes in the area
Home Values in the Area
Average Home Value in this Area
Purchase History
| Date | Buyer | Sale Price | Title Company |
|---|---|---|---|
| Pioquinto Avila And Alicia Avila Revocable Li | -- | None Listed On Document | |
| Avila Pioquinto | -- | -- | |
| Avila Nicolas | $140,000 | United Title Company | |
| Homeowners Equity Corp | $90,200 | United Title |
Source: Public Records
Mortgage History
| Date | Status | Borrower | Loan Amount |
|---|---|---|---|
| Previous Owner | Avila Pioquinto | $162,000 | |
| Previous Owner | Avila Nicolas | $139,020 |
Source: Public Records
Tax History Compared to Growth
Tax History
| Year | Tax Paid | Tax Assessment Tax Assessment Total Assessment is a certain percentage of the fair market value that is determined by local assessors to be the total taxable value of land and additions on the property. | Land | Improvement |
|---|---|---|---|---|
| 2025 | $4,039 | $293,353 | $174,469 | $118,884 |
| 2024 | $4,039 | $287,602 | $171,049 | $116,553 |
| 2023 | $3,919 | $281,964 | $167,696 | $114,268 |
| 2022 | $3,755 | $276,436 | $164,408 | $112,028 |
| 2021 | $3,685 | $271,017 | $161,185 | $109,832 |
| 2019 | $3,594 | $262,980 | $156,405 | $106,575 |
| 2018 | $3,432 | $257,825 | $153,339 | $104,486 |
| 2016 | $3,294 | $247,816 | $147,386 | $100,430 |
| 2015 | $3,214 | $244,095 | $145,173 | $98,922 |
| 2014 | $3,065 | $239,315 | $142,330 | $96,985 |
Source: Public Records
Map
Nearby Homes
- 14104 Barrydale St
- 1416 Millbury Ave
- 1525 Bromley Ave
- 979 Willow Ave Unit 31
- 943 Willow Ave
- 13974 Francisquito Ave Unit 8
- 1718 Puente Ave Unit 40
- 1003 Le Borgne Ave
- 1735 Puente Ave Unit 30
- 915 Stichman Ave
- 3060 Vineland Ave Unit 7
- 720 Le Borgne Ave
- 1528 W Delvale St
- 1311 S Leland Ave
- 1816 W Yarnell St
- 3004 Via Delores
- 1240 S Bromley Ave
- 3314 Baldwin Park Blvd
- 610 Willow Ave
- 13522 Francisquito Ave Unit C
- 1315 N Siesta Ave
- 1327 N Siesta Ave
- 1314 Mayland Ave
- 1308 Mayland Ave
- 1309 N Siesta Ave
- 1320 Mayland Ave
- 1333 N Siesta Ave
- 1302 Mayland Ave
- 1320 N Siesta Ave
- 1314 N Siesta Ave
- 1326 N Siesta Ave
- 1339 N Siesta Ave
- 1308 N Siesta Ave
- 1332 N Siesta Ave
- 1232 Mayland Ave
- 1332 Mayland Ave
- 1302 N Siesta Ave
- 1245 N Siesta Ave
- 1338 N Siesta Ave
- 13939 Janetdale St