

1321 Nadine Way Boulder City, NV 89005
Estimated payment $2,165/month
Highlights
- No HOA
- Covered Patio or Porch
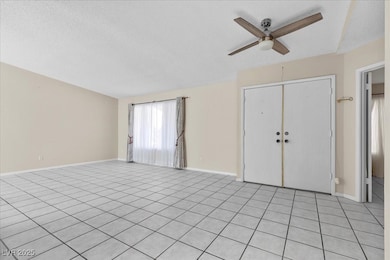
- Ceramic Tile Flooring
- Martha P. King Elementary School Rated 9+
- 2 Car Attached Garage
- 4-minute walk to Oasis Park
About This Home
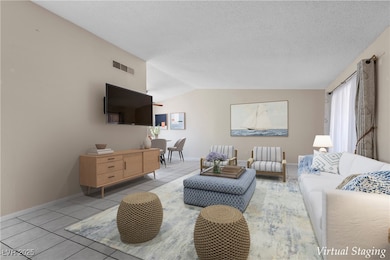
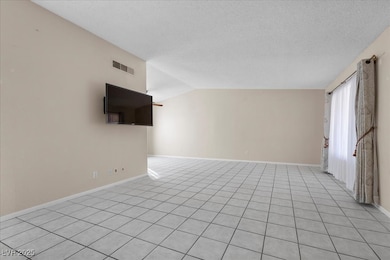
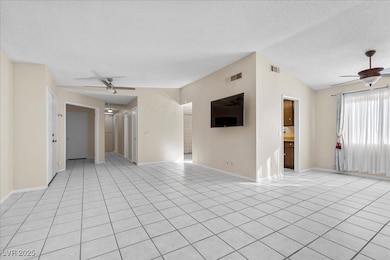
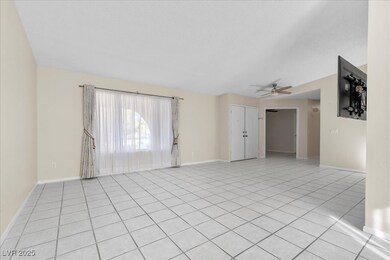
1321 Nadine Way presents an excellent opportunity to own a well-situated home in historic Boulder City. This property welcomes you with open living areas, comfortable bedrooms, and thoughtful features throughout. The backyard provides ample space for outdoor enjoyment. Located in the desirable Girl Streets neighborhood, you’ll be just minutes from schools, shopping, and outdoor adventure—including boating and hiking at Lake Mead. This home offers the perfect combination of lifestyle and value. Make this Boulder City gem your own and experience all the charm the community has to offer.
Listing Agent
Success Realty Brokerage Phone: 702-612-0300 License #S.0192509 Listed on: 09/30/2025
Home Details
Home Type
- Single Family
Est. Annual Taxes
- $1,267
Year Built
- Built in 1979
Lot Details
- 8,712 Sq Ft Lot
- West Facing Home
- Back Yard Fenced
- Block Wall Fence
- Desert Landscape
Parking
- 2 Car Attached Garage
Home Design
- Pitched Roof
- Shingle Roof
- Composition Roof
Interior Spaces
- 1,309 Sq Ft Home
- 1-Story Property
- Ceiling Fan
- Ceramic Tile Flooring
Kitchen
- Built-In Gas Oven
- Microwave
- Disposal
Bedrooms and Bathrooms
- 2 Bedrooms
Laundry
- Laundry on main level
- Laundry in Garage
- Dryer
- Washer
Outdoor Features
- Covered Patio or Porch
Schools
- Mitchell Elementary School
- Garrett Elton M. Middle School
- Boulder City High School
Utilities
- Central Heating and Cooling System
- Heating System Uses Gas
- Underground Utilities
Community Details
- No Home Owners Association
- Boulder City Sub #32 Bc 15 Lewis Homes Subdivision
Map
Home Values in the Area
Average Home Value in this Area
Tax History
| Year | Tax Paid | Tax Assessment Tax Assessment Total Assessment is a certain percentage of the fair market value that is determined by local assessors to be the total taxable value of land and additions on the property. | Land | Improvement |
|---|---|---|---|---|
| 2025 | $1,267 | $77,564 | $51,800 | $25,764 |
| 2024 | $1,230 | $77,564 | $51,800 | $25,764 |
| 2023 | $1,230 | $65,346 | $39,900 | $25,446 |
| 2022 | $1,200 | $58,828 | $35,000 | $23,828 |
| 2021 | $1,168 | $53,512 | $30,450 | $23,062 |
| 2020 | $1,132 | $53,737 | $30,450 | $23,287 |
| 2019 | $1,099 | $49,599 | $26,250 | $23,349 |
| 2018 | $1,068 | $45,958 | $23,100 | $22,858 |
| 2017 | $1,105 | $46,272 | $22,750 | $23,522 |
| 2016 | $1,009 | $44,543 | $20,300 | $24,243 |
| 2015 | $1,009 | $41,775 | $17,500 | $24,275 |
| 2014 | $979 | $40,419 | $15,750 | $24,669 |
Property History
| Date | Event | Price | List to Sale | Price per Sq Ft |
|---|---|---|---|---|
| 10/24/2025 10/24/25 | Pending | -- | -- | -- |
| 10/08/2025 10/08/25 | For Sale | $389,900 | -- | $298 / Sq Ft |
Purchase History
| Date | Type | Sale Price | Title Company |
|---|---|---|---|
| Quit Claim Deed | -- | None Listed On Document | |
| Interfamily Deed Transfer | -- | None Available | |
| Bargain Sale Deed | $305,000 | Chicago Title | |
| Bargain Sale Deed | $225,000 | Chicago Title | |
| Bargain Sale Deed | $134,000 | United Title |
Mortgage History
| Date | Status | Loan Amount | Loan Type |
|---|---|---|---|
| Previous Owner | $202,500 | Unknown | |
| Previous Owner | $85,000 | No Value Available |
Source: Las Vegas REALTORS®
MLS Number: 2723551
APN: 186-09-415-031
Disclaimer: Certain information contained herein is derived from information provided by parties other than Homes.com. All information provided is deemed reliable, but is not guaranteed to be accurate and should be independently verified.
![]() The data relating to real estate for sale on this web site comes in part from the INTERNET DATA EXCHANGE Program of the Greater Las Vegas Association of REALTORS® MLS. Real estate listings held by brokerage firms other than this site owner are marked with the IDX logo. Information is deemed reliable but not guaranteed. Copyright 2025 of the Greater Las Vegas Association of REALTORS® MLS. All rights reserved.
The data relating to real estate for sale on this web site comes in part from the INTERNET DATA EXCHANGE Program of the Greater Las Vegas Association of REALTORS® MLS. Real estate listings held by brokerage firms other than this site owner are marked with the IDX logo. Information is deemed reliable but not guaranteed. Copyright 2025 of the Greater Las Vegas Association of REALTORS® MLS. All rights reserved.
- 782 Sandra Dr
- 1316 Capri Dr Unit B
- 1316 Capri Dr
- 1316 Capri Dr Unit D
- 1303 Darlene Way Unit 102B
- 1324 Georgia Ave Unit A
- 894 Dianne Dr
- 1515 Darlene Way
- 839 Benita Place
- 834 Benita Place
- 976 El Camino Way
- 855 Del Rey Dr
- 770 Fairway Dr
- 870 B Unit 103
- 1201 I
- 1413 Pueblo Dr
- 1412 5th St
- 871 Armada Place
- 1305 New Mexico St
- 667 C
