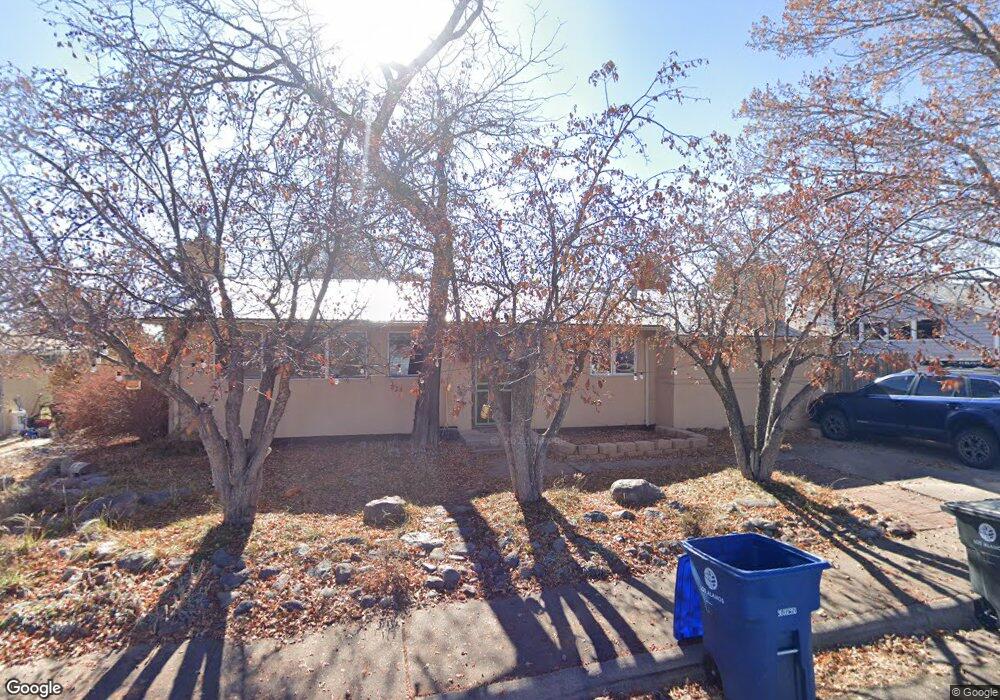
1321 Sage Loop Los Alamos, NM 87544
Estimated Value: $564,000 - $708,000
4
Beds
2
Baths
1,998
Sq Ft
$305/Sq Ft
Est. Value
About This Home
This home is located at 1321 Sage Loop, Los Alamos, NM 87544 and is currently estimated at $609,060, approximately $304 per square foot. 1321 Sage Loop is a home located in Los Alamos County with nearby schools including Aspen Elementary School, Los Alamos Middle School, and Los Alamos High School.
Ownership History
Date
Name
Owned For
Owner Type
Purchase Details
Closed on
Nov 4, 2020
Sold by
Hickmann Kyle S and Manore Carrie A
Bought by
Hickmann Kyle S and Manore Carrie A
Current Estimated Value
Home Financials for this Owner
Home Financials are based on the most recent Mortgage that was taken out on this home.
Original Mortgage
$255,739
Outstanding Balance
$185,115
Interest Rate
2.9%
Mortgage Type
New Conventional
Estimated Equity
$423,945
Purchase Details
Closed on
Mar 20, 2020
Sold by
Hickman Kyle S
Bought by
Hickman Kyle S
Purchase Details
Closed on
May 12, 2017
Sold by
Dreicer Jared S and Griego Janet E
Bought by
Hickmann Kyle S and Manor Carrie A
Home Financials for this Owner
Home Financials are based on the most recent Mortgage that was taken out on this home.
Original Mortgage
$271,920
Interest Rate
3.97%
Mortgage Type
New Conventional
Purchase Details
Closed on
Sep 30, 2011
Sold by
Dreicer Jard S and Grigo Dreicer Janet E
Bought by
Dreicer Jared S and Griego Dreicer Janet E
Create a Home Valuation Report for This Property
The Home Valuation Report is an in-depth analysis detailing your home's value as well as a comparison with similar homes in the area
Home Values in the Area
Average Home Value in this Area
Purchase History
| Date | Buyer | Sale Price | Title Company |
|---|---|---|---|
| Hickmann Kyle S | -- | None Available | |
| Hickmann Kyle S | -- | None Available | |
| Hickman Kyle S | -- | None Available | |
| Hickmann Kyle S | -- | None Available | |
| Dreicer Jared S | -- | -- |
Source: Public Records
Mortgage History
| Date | Status | Borrower | Loan Amount |
|---|---|---|---|
| Open | Hickmann Kyle S | $255,739 | |
| Closed | Hickmann Kyle S | $271,920 |
Source: Public Records
Tax History Compared to Growth
Tax History
| Year | Tax Paid | Tax Assessment Tax Assessment Total Assessment is a certain percentage of the fair market value that is determined by local assessors to be the total taxable value of land and additions on the property. | Land | Improvement |
|---|---|---|---|---|
| 2025 | $2,961 | $129,440 | $25,380 | $104,060 |
| 2024 | $2,961 | $125,660 | $24,990 | $100,670 |
| 2023 | $2,929 | $122,010 | $24,650 | $97,360 |
| 2022 | $2,861 | $118,450 | $24,270 | $94,180 |
| 2021 | $2,757 | $114,510 | $23,920 | $90,590 |
| 2020 | $2,727 | $111,180 | $23,660 | $87,520 |
| 2019 | $2,690 | $107,950 | $23,110 | $84,840 |
| 2018 | $2,629 | $104,800 | $22,500 | $82,300 |
| 2017 | $1,766 | $69,970 | $19,780 | $50,190 |
| 2016 | $1,607 | $67,930 | $19,700 | $48,230 |
| 2015 | $1,563 | $65,960 | $19,150 | $46,810 |
| 2014 | $1,457 | $66,500 | $19,150 | $47,350 |
| 2013 | $1,421 | $70,810 | $21,290 | $49,520 |
| 2011 | $1,361 | $65,190 | $14,450 | $50,740 |
Source: Public Records
Map
Nearby Homes
- 1300 Iris St Unit 101
- 445 Rim Rd
- 1970 Camino Redondo
- 1990 Camino Redondo
- 435 Camino Cereza
- 10 Loma Vista St
- 11 Loma Vista St
- 16 Short Dr
- 1984 Camino Manzana
- 49 Timber Ridge Rd
- 2819 Villa St Unit A & B
- 505 Oppenheimer Dr Unit 112
- 3055 Trinity Dr Unit 421
- 3055 Trinity Dr Unit 517
- 3055 Trinity Dr Unit 423
- 505 Oppenheimer Dr Unit 904
- 505 Oppenheimer Dr Unit 108
- 505 Oppenheimer Dr Unit 414
- 505 Oppenheimer Dr Unit 511
- 23 Timber Ridge Rd
- 1311 Sage Loop
- 1331 Sage Loop
- 1463 Oakwood Loop
- 1441 11th St
- 1307 Sage Loop
- 1320 Sage Loop
- 1333 Sage Loop
- 1063 Pinon Loop
- 1465 Oakwood Loop
- 1312 Sage Loop
- 1088 Opal St
- 1306 Sage Loop
- 1335 Sage Loop
- 1461 Oakwood Loop
- 1305 Sage Loop
- 1431 11th St
- 1467 Oakwood Loop
- 1061 Pinon Loop
- 1342 Sage Loop
- 1068 Opal St