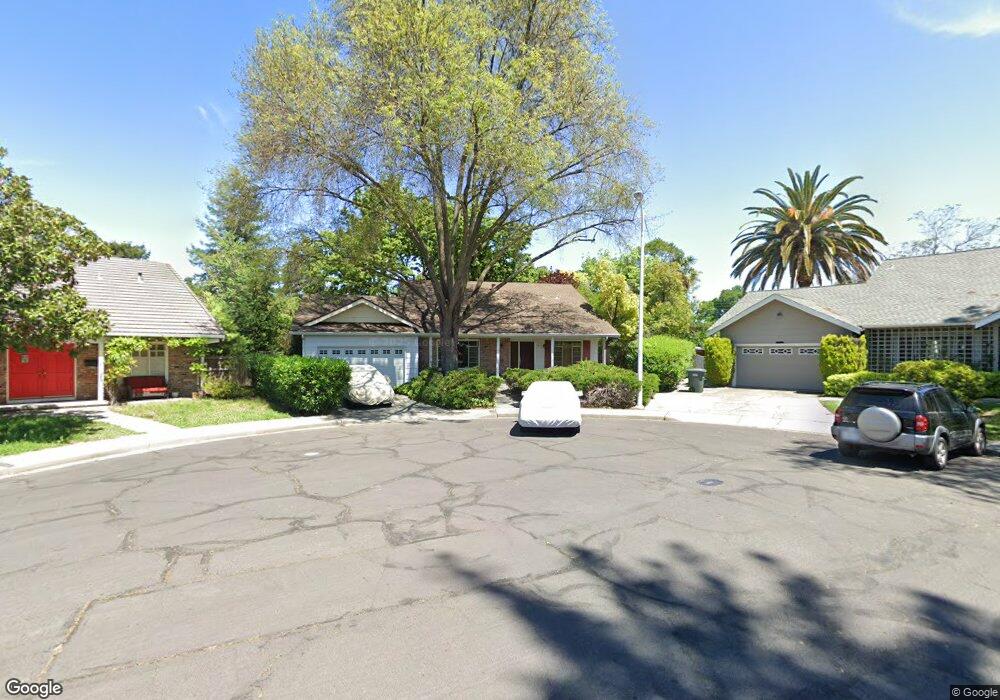
1321 Strathmore Ct Concord, CA 94518
Colony Park NeighborhoodEstimated Value: $923,000 - $1,002,000
4
Beds
2
Baths
2,091
Sq Ft
$458/Sq Ft
Est. Value
About This Home
This home is located at 1321 Strathmore Ct, Concord, CA 94518 and is currently estimated at $957,350, approximately $457 per square foot. 1321 Strathmore Ct is a home located in Contra Costa County with nearby schools including Fair Oaks Elementary School, Pleasant Hill Middle School, and Ygnacio Valley High School.
Ownership History
Date
Name
Owned For
Owner Type
Purchase Details
Closed on
Dec 9, 2009
Sold by
Nerney James C and Nerney Lynnette L
Bought by
Nerney James C and Nerney Lynette L
Current Estimated Value
Purchase Details
Closed on
Apr 15, 2002
Sold by
Nerney James C and Nerney Lynette L
Bought by
Nerney James C and Nerney Lynette L
Home Financials for this Owner
Home Financials are based on the most recent Mortgage that was taken out on this home.
Original Mortgage
$186,000
Interest Rate
6.8%
Mortgage Type
Purchase Money Mortgage
Purchase Details
Closed on
Feb 20, 2002
Sold by
Nerney James C and Nerney Lynette L
Bought by
Nerney James C and Nerney Lynette L
Home Financials for this Owner
Home Financials are based on the most recent Mortgage that was taken out on this home.
Original Mortgage
$186,000
Interest Rate
6.8%
Mortgage Type
Purchase Money Mortgage
Purchase Details
Closed on
Dec 5, 2000
Sold by
Nerney James C and Nerney Lynette L
Bought by
Nerney James C and Nerney Lynette L
Create a Home Valuation Report for This Property
The Home Valuation Report is an in-depth analysis detailing your home's value as well as a comparison with similar homes in the area
Home Values in the Area
Average Home Value in this Area
Purchase History
| Date | Buyer | Sale Price | Title Company |
|---|---|---|---|
| Nerney James C | -- | None Available | |
| Nerney James C | -- | None Available | |
| Nerney James C | -- | -- | |
| Nerney James C | -- | Chicago Title Co | |
| Nerney James C | -- | -- |
Source: Public Records
Mortgage History
| Date | Status | Borrower | Loan Amount |
|---|---|---|---|
| Closed | Nerney James C | $186,000 |
Source: Public Records
Tax History Compared to Growth
Tax History
| Year | Tax Paid | Tax Assessment Tax Assessment Total Assessment is a certain percentage of the fair market value that is determined by local assessors to be the total taxable value of land and additions on the property. | Land | Improvement |
|---|---|---|---|---|
| 2025 | $4,032 | $305,241 | $110,700 | $194,541 |
| 2024 | $3,955 | $299,257 | $108,530 | $190,727 |
| 2023 | $3,955 | $293,390 | $106,402 | $186,988 |
| 2022 | $3,919 | $287,638 | $104,316 | $183,322 |
| 2021 | $3,822 | $281,999 | $102,271 | $179,728 |
| 2019 | $3,708 | $273,638 | $99,239 | $174,399 |
| 2018 | $3,569 | $268,274 | $97,294 | $170,980 |
| 2017 | $3,511 | $263,015 | $95,387 | $167,628 |
| 2016 | $3,412 | $257,859 | $93,517 | $164,342 |
| 2015 | $3,369 | $253,987 | $92,113 | $161,874 |
| 2014 | $3,309 | $249,013 | $90,309 | $158,704 |
Source: Public Records
Map
Nearby Homes
- 1271 Hookston Rd
- 1024 Bermuda Dr
- 1509 Wicket Ct
- 1218 Hookston Rd
- 1014 Bancroft Rd
- 1640 Amhurst Way
- 1040 Mohr Ln Unit C
- 1038 Mohr Ln Unit A
- 914 Bancroft Rd
- 1064 Mohr Ln Unit C
- 1091 Mohr Ln Unit D
- 1356 Del Rio Cir Unit D
- 1369 Del Rio Cir Unit C
- 1076 Mohr Ln Unit B
- 51 Village Square Place
- 1096 Mohr Ln
- 903 Dartmouth Way
- 22 Village Square Place
- 192 Mayhew Way
- 54 Village Square Place
- 1320 Aberdeen Ct
- 1330 Strathmore Ct
- 1311 Strathmore Ct
- 1310 Aberdeen Ct
- 1330 Aberdeen Ct
- 1320 Strathmore Ct
- 1006 Bermuda Dr
- 1310 Strathmore Ct
- 1012 Bermuda Dr
- 1004 Bermuda Dr
- 1331 Hookston Rd
- 1321 Hookston Rd
- 1311 Hookston Rd
- 1309 Aberdeen Ct
- 1311 Aberdeen Ct
- 1306 Gragg Ln
- 1009 Bermuda Dr
- 1000 Bermuda Dr
- 1011 Bermuda Dr
- 1007 Bermuda Dr