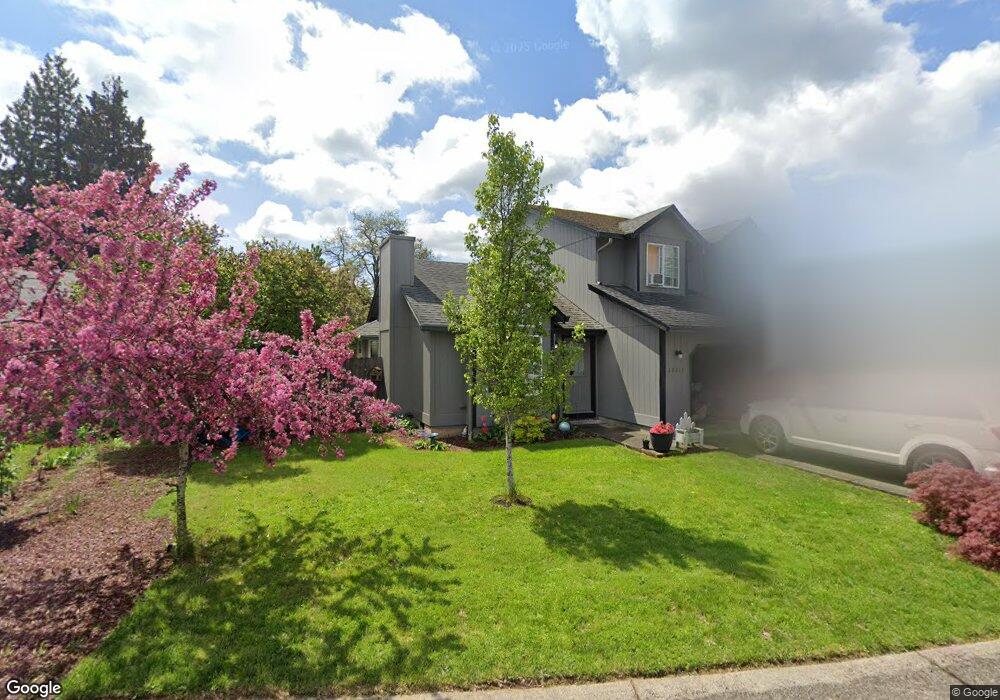
13211 NE 36th St Vancouver, WA 98682
Image NeighborhoodEstimated Value: $443,000 - $489,000
3
Beds
3
Baths
1,524
Sq Ft
$301/Sq Ft
Est. Value
About This Home
This home is located at 13211 NE 36th St, Vancouver, WA 98682 and is currently estimated at $459,290, approximately $301 per square foot. 13211 NE 36th St is a home located in Clark County with nearby schools including Endeavour Elementary School, Cascade Middle School, and Evergreen High School.
Ownership History
Date
Name
Owned For
Owner Type
Purchase Details
Closed on
Mar 23, 2009
Sold by
Jeanblanc Robert C and Jeanblanc Kristine S
Bought by
Lyle Joseph D
Current Estimated Value
Home Financials for this Owner
Home Financials are based on the most recent Mortgage that was taken out on this home.
Original Mortgage
$185,708
Outstanding Balance
$118,460
Interest Rate
5.19%
Mortgage Type
VA
Estimated Equity
$340,830
Purchase Details
Closed on
Oct 3, 2002
Sold by
Brunk Jane E and Crowe Jane E
Bought by
Jeanblanc Robert C and Jeanblanc Kristine S
Home Financials for this Owner
Home Financials are based on the most recent Mortgage that was taken out on this home.
Original Mortgage
$159,732
Interest Rate
6.22%
Mortgage Type
VA
Create a Home Valuation Report for This Property
The Home Valuation Report is an in-depth analysis detailing your home's value as well as a comparison with similar homes in the area
Home Values in the Area
Average Home Value in this Area
Purchase History
| Date | Buyer | Sale Price | Title Company |
|---|---|---|---|
| Lyle Joseph D | $181,800 | Clark County Title | |
| Jeanblanc Robert C | $156,600 | Stewart Title |
Source: Public Records
Mortgage History
| Date | Status | Borrower | Loan Amount |
|---|---|---|---|
| Open | Lyle Joseph D | $185,708 | |
| Previous Owner | Jeanblanc Robert C | $159,732 |
Source: Public Records
Tax History Compared to Growth
Tax History
| Year | Tax Paid | Tax Assessment Tax Assessment Total Assessment is a certain percentage of the fair market value that is determined by local assessors to be the total taxable value of land and additions on the property. | Land | Improvement |
|---|---|---|---|---|
| 2025 | $3,800 | $389,281 | $198,000 | $191,281 |
| 2024 | $3,724 | $382,852 | $198,000 | $184,852 |
| 2023 | $3,695 | $389,232 | $198,000 | $191,232 |
| 2022 | $3,292 | $381,599 | $198,000 | $183,599 |
| 2021 | $3,140 | $322,405 | $168,000 | $154,405 |
| 2020 | $3,073 | $290,663 | $150,000 | $140,663 |
| 2019 | $2,676 | $287,226 | $127,400 | $159,826 |
| 2018 | $2,757 | $269,322 | $0 | $0 |
| 2017 | $2,666 | $223,028 | $0 | $0 |
| 2016 | $2,431 | $223,336 | $0 | $0 |
| 2015 | $2,426 | $195,004 | $0 | $0 |
| 2014 | -- | $186,017 | $0 | $0 |
| 2013 | -- | $156,881 | $0 | $0 |
Source: Public Records
Map
Nearby Homes
- 12816 NE 37th St
- 0 NE 39th St
- 3908 NE 131st Ave
- 13100 NE 30th Cir
- 4008 NE 131st Ct
- 2836 NE 137th Ct
- 13815 NE 33rd Cir
- 4206 NE 130th Ave
- 13014 NE 28th Way
- 3101 NE 138th Ave
- 12800 NE 28th St
- 3209 NE 124th Ave
- 12406 NE 37th St
- 4309 NE 130th Ave
- 4315 NE 135th Ave
- 13401 NE 28th St Unit 407
- 2642 NE 131st Ave
- 12416 NE 39th St
- 12611 NE 44th St
- 4301 NE 137th Ave
- 13215 NE 36th St
- 3509 NE 132nd Ave
- 13304 NE 34th Cir
- 13303 NE 36th St
- 3417 NE 132nd Ave
- 13308 NE 34th Cir
- 13212 NE 36th St
- 13216 NE 36th St
- 13206 NE 36th St
- 13311 NE 36th St
- 13300 NE 34th Cir
- 13304 NE 36th St
- 3508 NE 132nd Ave
- 3500 NE 132nd Ave
- 13312 NE 34th Cir
- 3412 NE 132nd Ave
- 13310 NE 36th St
- 13118 NE 36th Cir
- 13315 NE 36th St
- 3611 NE 132nd Ave