Estimated Value: $931,000 - $1,099,000
6
Beds
3
Baths
3,285
Sq Ft
$315/Sq Ft
Est. Value
About This Home
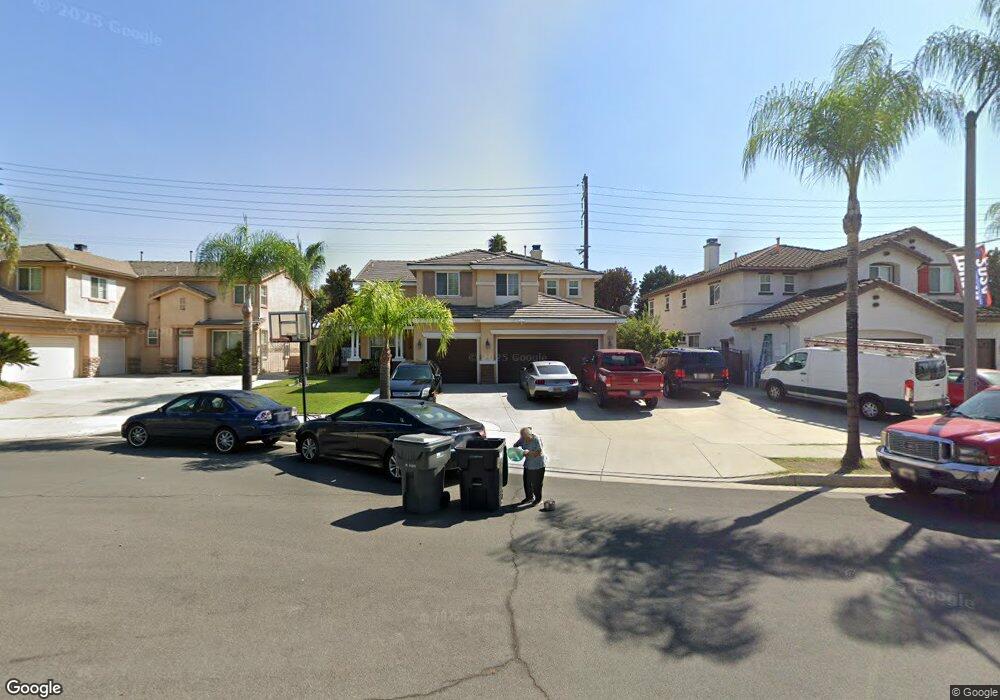
This home is located at 13211 Rancho Bernard Ct, Chino, CA 91710 and is currently estimated at $1,033,411, approximately $314 per square foot. 13211 Rancho Bernard Ct is a home located in San Bernardino County with nearby schools including Alicia Cortez Elementary, Magnolia Junior High, and Chino High School.
Ownership History
Date
Name
Owned For
Owner Type
Purchase Details
Closed on
Jan 24, 2020
Sold by
Fernandez Juan Carlos
Bought by
Morales Oralia
Current Estimated Value
Purchase Details
Closed on
Oct 22, 2019
Sold by
Coronel Martin Antonio and Coronel Maria Luisa
Bought by
Garcia Humberto and Morales Oralia
Home Financials for this Owner
Home Financials are based on the most recent Mortgage that was taken out on this home.
Original Mortgage
$419,040
Interest Rate
3.7%
Mortgage Type
New Conventional
Purchase Details
Closed on
Apr 3, 2003
Sold by
Chino Magnolia Llc
Bought by
Coronel Martin Antonio and Coronel Maria Luisa
Home Financials for this Owner
Home Financials are based on the most recent Mortgage that was taken out on this home.
Original Mortgage
$317,992
Interest Rate
5.72%
Create a Home Valuation Report for This Property
The Home Valuation Report is an in-depth analysis detailing your home's value as well as a comparison with similar homes in the area
Home Values in the Area
Average Home Value in this Area
Purchase History
| Date | Buyer | Sale Price | Title Company |
|---|---|---|---|
| Morales Oralia | -- | Lawyers Title Company | |
| Garcia Humberto | -- | Lawyers Title | |
| Garcia Humberto | $432,000 | Lawyers Title Company | |
| Coronel Martin Antonio | $397,500 | Fidelity |
Source: Public Records
Mortgage History
| Date | Status | Borrower | Loan Amount |
|---|---|---|---|
| Previous Owner | Garcia Humberto | $419,040 | |
| Previous Owner | Coronel Martin Antonio | $317,992 | |
| Closed | Coronel Martin Antonio | $39,749 |
Source: Public Records
Tax History Compared to Growth
Tax History
| Year | Tax Paid | Tax Assessment Tax Assessment Total Assessment is a certain percentage of the fair market value that is determined by local assessors to be the total taxable value of land and additions on the property. | Land | Improvement |
|---|---|---|---|---|
| 2025 | $7,720 | $688,999 | $240,603 | $448,396 |
| 2024 | $7,720 | $675,489 | $235,885 | $439,604 |
| 2023 | $7,506 | $662,244 | $231,260 | $430,984 |
| 2022 | $7,446 | $649,258 | $226,725 | $422,533 |
| 2021 | $7,288 | $636,527 | $222,279 | $414,248 |
| 2020 | $6,048 | $526,408 | $132,433 | $393,975 |
| 2019 | $5,940 | $516,086 | $129,836 | $386,250 |
| 2018 | $5,807 | $505,966 | $127,290 | $378,676 |
| 2017 | $5,705 | $496,045 | $124,794 | $371,251 |
| 2016 | $5,339 | $486,319 | $122,347 | $363,972 |
| 2015 | $5,230 | $479,014 | $120,509 | $358,505 |
| 2014 | $5,130 | $469,630 | $118,148 | $351,482 |
Source: Public Records
Map
Nearby Homes
- 6031 Rosa Ct
- 13014 Bermuda Ave
- 13555 Magnolia Ave
- 13536 Sycamore Ln
- 12936 Cambridge Ct
- 5925 Riverside Dr Unit 12
- 11610 Granville Place
- 12951 Red Cedar Way
- 6441 Susana St
- 12951 Benson Ave Unit 118
- 13022 Cypress Ave
- 12811 Oaks Ave
- 13006 Falcon Place
- 12796 17th St
- 12947 Robin Ln
- 5640 Riverside Dr Unit 119
- 13119 San Antonio Ave
- 13775 Harvard Ave
- 0 C St
- 6630 Mogano Dr
- 13221 Rancho Bernard Ct
- 13201 Rancho Bernard Ct
- 6087 Rosario St
- 6075 Rosario St
- 6110 Anita St
- 13212 Rancho Bernard Ct
- 13241 Rancho Bernard Ct
- 6063 Rosario St
- 13222 Rancho Bernard Ct
- 13239 Magnolia Ave
- 13232 Rancho Bernard Ct
- 6051 Rosario St
- 13251 Magnolia Ave
- 6122 Anita St
- 13251 Rancho Bernard Ct
- 13242 Rancho Bernard Ct
- 13263 Magnolia Ave
- 6127 Anita St
- 6049 Rosario St
- 13211 Sequoia Ct