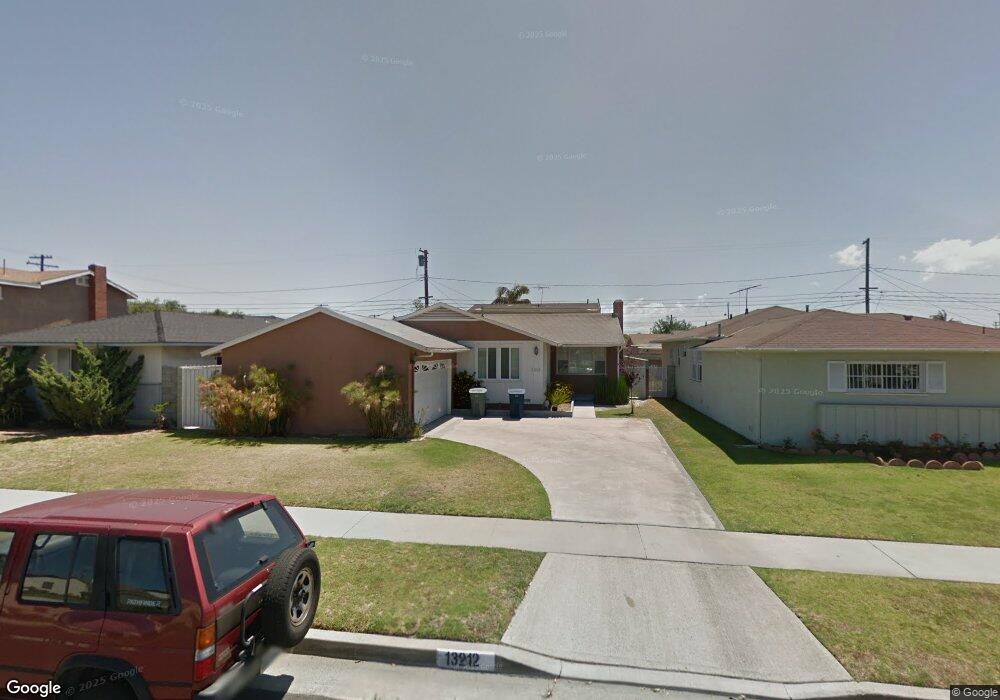
13212 Ruthelen St Gardena, CA 90249
Estimated Value: $747,000 - $869,000
3
Beds
2
Baths
1,501
Sq Ft
$548/Sq Ft
Est. Value
About This Home
This home is located at 13212 Ruthelen St, Gardena, CA 90249 and is currently estimated at $822,525, approximately $547 per square foot. 13212 Ruthelen St is a home located in Los Angeles County with nearby schools including Purche Avenue Elementary School, Robert E. Peary Middle School, and Gardena Senior High School.
Ownership History
Date
Name
Owned For
Owner Type
Purchase Details
Closed on
Jul 21, 2005
Sold by
Silas Joyce Marie
Bought by
Hollis Arlene R
Current Estimated Value
Home Financials for this Owner
Home Financials are based on the most recent Mortgage that was taken out on this home.
Original Mortgage
$47,450
Outstanding Balance
$24,689
Interest Rate
5.61%
Mortgage Type
Credit Line Revolving
Estimated Equity
$797,836
Purchase Details
Closed on
Jan 25, 1999
Sold by
Silas Ronald
Bought by
Silas Ronald M and Silas Joyce M
Purchase Details
Closed on
Oct 3, 1997
Sold by
Mays Travis
Bought by
Silas Ronald M and Silas Joyce Marie
Home Financials for this Owner
Home Financials are based on the most recent Mortgage that was taken out on this home.
Original Mortgage
$156,800
Interest Rate
7.05%
Mortgage Type
FHA
Create a Home Valuation Report for This Property
The Home Valuation Report is an in-depth analysis detailing your home's value as well as a comparison with similar homes in the area
Home Values in the Area
Average Home Value in this Area
Purchase History
| Date | Buyer | Sale Price | Title Company |
|---|---|---|---|
| Hollis Arlene R | $475,000 | Commonwealth Title | |
| Silas Joyce Marie | -- | Commonwealth Title | |
| Silas Ronald M | -- | -- | |
| Silas Ronald M | $172,000 | First American Title Co |
Source: Public Records
Mortgage History
| Date | Status | Borrower | Loan Amount |
|---|---|---|---|
| Open | Silas Joyce Marie | $47,450 | |
| Open | Hollis Arlene R | $380,000 | |
| Previous Owner | Silas Ronald M | $156,800 |
Source: Public Records
Tax History Compared to Growth
Tax History
| Year | Tax Paid | Tax Assessment Tax Assessment Total Assessment is a certain percentage of the fair market value that is determined by local assessors to be the total taxable value of land and additions on the property. | Land | Improvement |
|---|---|---|---|---|
| 2025 | $8,023 | $649,109 | $519,293 | $129,816 |
| 2024 | $8,023 | $636,382 | $509,111 | $127,271 |
| 2023 | $7,880 | $623,905 | $499,129 | $124,776 |
| 2022 | $7,487 | $611,673 | $489,343 | $122,330 |
| 2021 | $7,405 | $599,681 | $479,749 | $119,932 |
| 2019 | $7,164 | $581,896 | $465,520 | $116,376 |
| 2018 | $6,196 | $498,000 | $399,000 | $99,000 |
| 2016 | $5,422 | $436,000 | $349,000 | $87,000 |
| 2015 | $4,696 | $375,000 | $300,000 | $75,000 |
| 2014 | $4,259 | $331,000 | $265,000 | $66,000 |
Source: Public Records
Map
Nearby Homes
- 13204 S Wilton Place
- 1819 W 129th St
- 1618 W 132nd St Unit 17
- 13115 Spinning Ave
- 13404 Arcturus Ave
- 13709 Spinning Ave
- 2611 W 129th St
- 13228 S Wilkie Ave
- 1617 W 125th St
- 13621 Arcturus Ave
- 1349 W 135th St Unit 21
- 2911 W 129th St
- 13919 S Normandie Ave Unit 20
- 13628 S Mariposa Ave
- 1736 W 144th St
- 12018 Millennium Park Ct
- 1722 W 120th St
- 1448 Azalea Cir
- 1730 W 145th St Unit 9I
- 1261 139th St
- 13208 Ruthelen St
- 13216 Ruthelen St
- 13211 S Saint Andrews Place
- 13204 Ruthelen St
- 13220 Ruthelen St
- 13207 S Saint Andrews Place
- 13215 S Saint Andrews Place
- 13203 S Saint Andrews Place
- 13219 S Saint Andrews Place
- 13211 Ruthelen St
- 13224 Ruthelen St
- 13215 Ruthelen St
- 13203 Ruthelen St
- 13219 Ruthelen St
- 13223 S Saint Andrews Place
- 13228 Ruthelen St
- 13223 Ruthelen St
- 13120 Ruthelen St
- 13227 S Saint Andrews Place
- 13119 S Saint Andrews Place