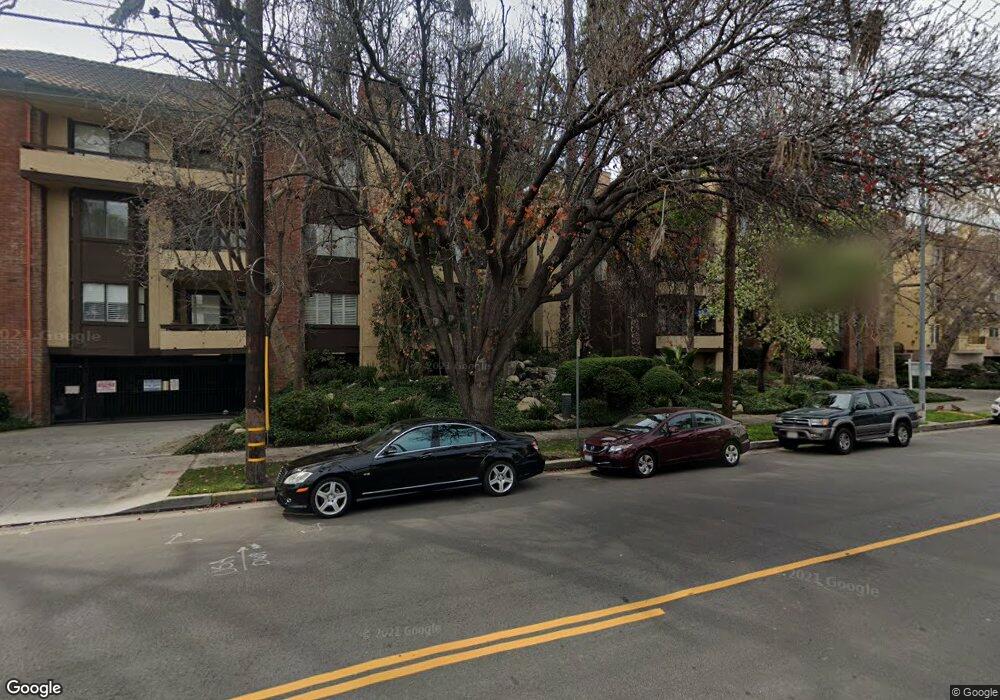
13214 Moorpark St Unit 207 Sherman Oaks, CA 91423
Estimated Value: $754,609 - $811,000
3
Beds
3
Baths
1,746
Sq Ft
$445/Sq Ft
Est. Value
About This Home
This home is located at 13214 Moorpark St Unit 207, Sherman Oaks, CA 91423 and is currently estimated at $776,652, approximately $444 per square foot. 13214 Moorpark St Unit 207 is a home located in Los Angeles County with nearby schools including Ulysses S. Grant Senior High School, Dixie Canyon Avenue Elementary School, and Riverside Drive Charter Elementary School.
Ownership History
Date
Name
Owned For
Owner Type
Purchase Details
Closed on
Feb 16, 2022
Sold by
Keith Allison Sydney
Bought by
Allison Sydney Keith and Allison Tina
Current Estimated Value
Purchase Details
Closed on
Apr 22, 2016
Sold by
Allison Sydney Keith and Stern Tina
Bought by
The Sydney Keith Allison & Tina Stern Li
Purchase Details
Closed on
Oct 29, 2009
Sold by
Allison Keith
Bought by
Allison Sydney Keith and Stern Tina
Home Financials for this Owner
Home Financials are based on the most recent Mortgage that was taken out on this home.
Original Mortgage
$380,000
Interest Rate
5.02%
Mortgage Type
New Conventional
Purchase Details
Closed on
Jul 20, 1999
Sold by
Sant Julia Tr and Sant Melvin
Bought by
Allison Keith
Home Financials for this Owner
Home Financials are based on the most recent Mortgage that was taken out on this home.
Original Mortgage
$152,950
Interest Rate
7.47%
Create a Home Valuation Report for This Property
The Home Valuation Report is an in-depth analysis detailing your home's value as well as a comparison with similar homes in the area
Home Values in the Area
Average Home Value in this Area
Purchase History
| Date | Buyer | Sale Price | Title Company |
|---|---|---|---|
| Allison Sydney Keith | -- | -- | |
| The Sydney Keith Allison & Tina Stern Li | -- | None Available | |
| Allison Sydney Keith | -- | Orange Coast Title Company | |
| Allison Keith | $170,000 | Lawyers Title Insurance Co |
Source: Public Records
Mortgage History
| Date | Status | Borrower | Loan Amount |
|---|---|---|---|
| Previous Owner | Allison Sydney Keith | $380,000 | |
| Previous Owner | Allison Keith | $152,950 |
Source: Public Records
Tax History Compared to Growth
Tax History
| Year | Tax Paid | Tax Assessment Tax Assessment Total Assessment is a certain percentage of the fair market value that is determined by local assessors to be the total taxable value of land and additions on the property. | Land | Improvement |
|---|---|---|---|---|
| 2025 | $3,194 | $261,262 | $52,241 | $209,021 |
| 2024 | $3,194 | $256,140 | $51,217 | $204,923 |
| 2023 | $3,133 | $251,118 | $50,213 | $200,905 |
| 2022 | $2,986 | $246,195 | $49,229 | $196,966 |
| 2021 | $2,940 | $241,368 | $48,264 | $193,104 |
| 2019 | $2,850 | $234,211 | $46,834 | $187,377 |
| 2018 | $2,826 | $229,619 | $45,916 | $183,703 |
| 2016 | $2,681 | $220,704 | $44,134 | $176,570 |
| 2015 | $2,642 | $217,390 | $43,472 | $173,918 |
| 2014 | $2,655 | $213,133 | $42,621 | $170,512 |
Source: Public Records
Map
Nearby Homes
- 13200 Moorpark St Unit 201
- 4301 Fulton Ave Unit 303
- 4301 Fulton Ave Unit 301
- 4249 Longridge Ave Unit 102
- 4259 Fulton Ave Unit 103
- 13220 Valleyheart Dr Unit 106
- 4455 Fulton Ave Unit 3
- 13331 Moorpark St Unit 123
- 13331 Moorpark St Unit 206
- 13331 Moorpark St Unit 319
- 4539 Atoll Ave
- 13021 Moorpark St
- 13024 Bloomfield St
- 4226 Greenbush Ave
- 4216 Greenbush Ave
- 12945 Moorpark St
- 4615 Fulton Ave
- 13453 Moorpark St
- 4445 Van Noord Ave
- 13012 Valleyheart Dr Unit 8
- 13214 Moorpark St
- 13214 Moorpark St Unit 204
- 13214 Moorpark St Unit 201
- 13214 Moorpark St Unit 109
- 13214 Moorpark St Unit 108
- 13214 Moorpark St Unit 107
- 13214 Moorpark St Unit 104
- 13214 Moorpark St Unit 103
- 13214 Moorpark St Unit 102
- 13214 Moorpark St Unit 309
- 13214 Moorpark St Unit 308
- 13214 Moorpark St Unit 307
- 13214 Moorpark St Unit 304
- 13214 Moorpark St Unit 303
- 13214 Moorpark St Unit 302
- 13214 Moorpark St Unit 209
- 13214 Moorpark St Unit 208
- 13214 Moorpark St Unit 206
- 13214 Moorpark St Unit 205
- 13214 Moorpark St Unit 203