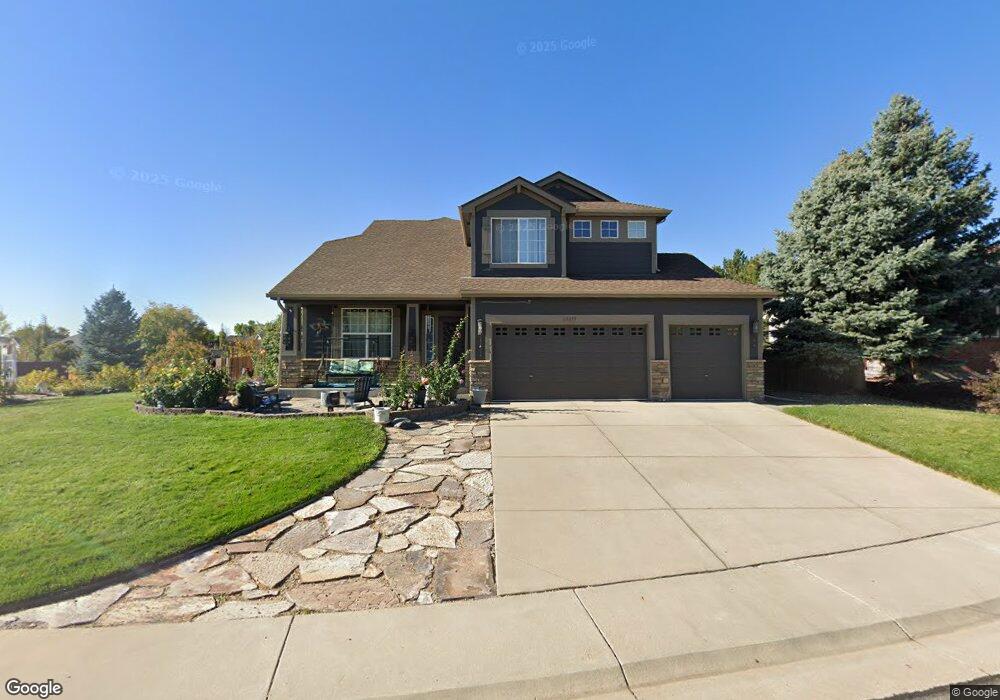
13217 Ivy Ct Thornton, CO 80602
Riverdale Park NeighborhoodEstimated Value: $666,659 - $682,000
4
Beds
3
Baths
4,398
Sq Ft
$154/Sq Ft
Est. Value
About This Home
This home is located at 13217 Ivy Ct, Thornton, CO 80602 and is currently estimated at $676,665, approximately $153 per square foot. 13217 Ivy Ct is a home located in Adams County with nearby schools including West Ridge Elementary School, Rodger Quist Middle School, and Riverdale Ridge High School.
Ownership History
Date
Name
Owned For
Owner Type
Purchase Details
Closed on
Jul 30, 2010
Sold by
The Buy Out Company Lllp
Bought by
Gustafson Anthony and Gustafson Pamela
Current Estimated Value
Home Financials for this Owner
Home Financials are based on the most recent Mortgage that was taken out on this home.
Original Mortgage
$276,279
Outstanding Balance
$177,046
Interest Rate
4.25%
Mortgage Type
FHA
Estimated Equity
$499,619
Purchase Details
Closed on
Jun 9, 2010
Sold by
Hawkins Annette R and Hawkins Delbert O
Bought by
The Buy Out Company Lllp
Home Financials for this Owner
Home Financials are based on the most recent Mortgage that was taken out on this home.
Original Mortgage
$276,279
Outstanding Balance
$177,046
Interest Rate
4.25%
Mortgage Type
FHA
Estimated Equity
$499,619
Purchase Details
Closed on
Oct 22, 2004
Sold by
Kdb Homes Inc
Bought by
Hawkins Delbert O and Hawkins Annette R
Home Financials for this Owner
Home Financials are based on the most recent Mortgage that was taken out on this home.
Original Mortgage
$328,605
Interest Rate
5.73%
Mortgage Type
Unknown
Create a Home Valuation Report for This Property
The Home Valuation Report is an in-depth analysis detailing your home's value as well as a comparison with similar homes in the area
Home Values in the Area
Average Home Value in this Area
Purchase History
We collect this data history from publicly available records. To have your information removed, we recommend requesting removal directly through your county’s website.
| Date | Buyer | Sale Price | Title Company |
|---|---|---|---|
| Gustafson Anthony | $280,000 | Land Title Guarantee Company | |
| The Buy Out Company Lllp | -- | None Available | |
| Hawkins Delbert O | $345,900 | Fahtco |
Source: Public Records
Mortgage History
We collect this data history from publicly available records. To have your information removed, we recommend requesting removal directly through your county’s website.
| Date | Status | Borrower | Loan Amount |
|---|---|---|---|
| Open | Gustafson Anthony | $276,279 | |
| Previous Owner | Hawkins Delbert O | $328,605 |
Source: Public Records
Tax History
| Year | Tax Paid | Tax Assessment Tax Assessment Total Assessment is a certain percentage of the fair market value that is determined by local assessors to be the total taxable value of land and additions on the property. | Land | Improvement |
|---|---|---|---|---|
| 2025 | $4,084 | $44,000 | $7,820 | $36,180 |
| 2024 | $4,084 | $40,440 | $7,190 | $33,250 |
| 2023 | $4,065 | $45,600 | $6,970 | $38,630 |
| 2022 | $3,267 | $33,310 | $7,160 | $26,150 |
| 2021 | $3,146 | $33,310 | $7,160 | $26,150 |
| 2020 | $3,026 | $33,430 | $7,360 | $26,070 |
| 2019 | $3,029 | $33,430 | $7,360 | $26,070 |
| 2018 | $2,894 | $31,920 | $6,840 | $25,080 |
| 2017 | $2,890 | $31,920 | $6,840 | $25,080 |
| 2016 | $2,411 | $26,540 | $4,460 | $22,080 |
| 2015 | $2,406 | $26,540 | $4,460 | $22,080 |
| 2014 | -- | $23,610 | $4,140 | $19,470 |
Source: Public Records
Map
Nearby Homes
- 13135 Ivy Place
- 13313 Jersey St
- 13324 Jersey St
- 6315 E 133rd Ave
- 12940 Jasmine St Unit B
- 13480 Ivy St
- 13122 Summit Grove Pkwy
- 12876 Jasmine St Unit E
- 12852 Jasmine St Unit E
- 12907 Krameria St
- 6301 E 135th Place
- 12794 Ivy St
- 12820 Jasmine St Unit F
- 12840 Jasmine St Unit D
- 13199 Birch Way
- 12822 Jasmine St Unit E
- 12780 Ivanhoe St
- 5241 E 128th Way
- 4756 E 129th Place
- 4560 Cottonwood Lakes Blvd
- 13227 Ivy Ct
- 13185 Ivanhoe St
- 13189 Ivanhoe St
- 13224 Ivy Ct
- 13216 Ivy Ct
- 13208 Ivy Ct
- 13179 Ivanhoe St
- 13232 Ivy Ct
- 13233 Ivy Ct
- 13238 Ivy Ct
- 13241 Ivy Ct
- 13190 Ivy Place
- 5776 E 132nd Way
- 13169 Ivanhoe St
- 13182 Ivy Place
- 13172 Ivanhoe St
- 13159 Ivanhoe St
- 13176 Ivy Place
- 13152 Ivanhoe St
- 5751 E 132nd Way
Your Personal Tour Guide
Ask me questions while you tour the home.