Estimated Value: $1,388,182 - $1,655,000
3
Beds
2
Baths
1,807
Sq Ft
$830/Sq Ft
Est. Value
About This Home
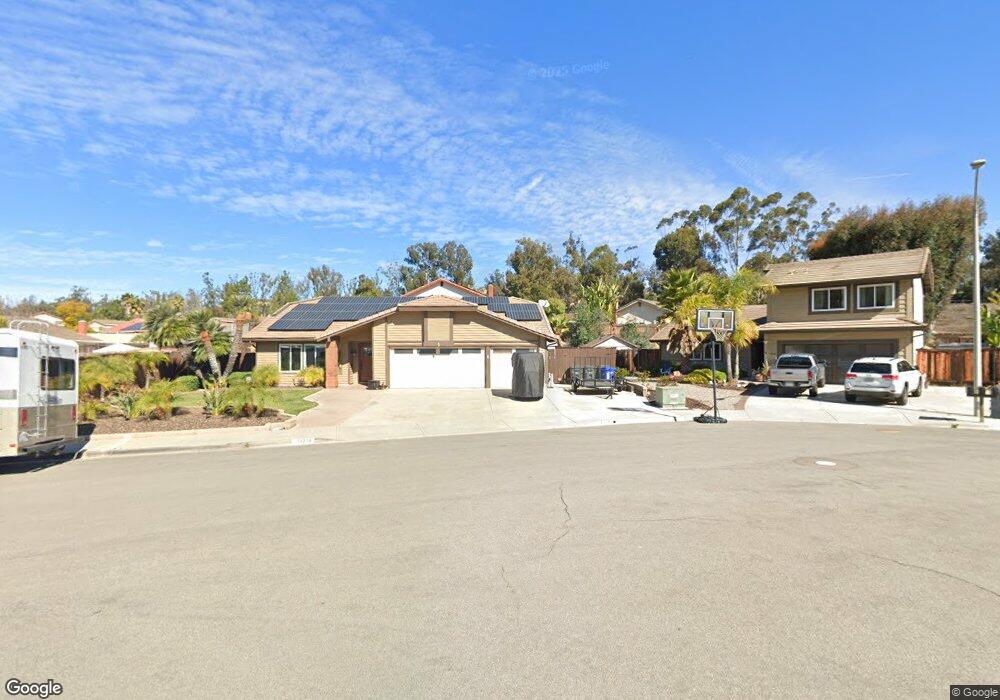
This home is located at 13218 Ironbark Way, Poway, CA 92064 and is currently estimated at $1,499,296, approximately $829 per square foot. 13218 Ironbark Way is a home located in San Diego County with nearby schools including Midland Elementary, Twin Peaks Middle, and Poway High.
Ownership History
Date
Name
Owned For
Owner Type
Purchase Details
Closed on
Sep 7, 2021
Sold by
Raggo Clifford and Raggo Melissa
Bought by
Raggo Clifford and Raggo Melissa
Current Estimated Value
Home Financials for this Owner
Home Financials are based on the most recent Mortgage that was taken out on this home.
Original Mortgage
$501,000
Outstanding Balance
$455,873
Interest Rate
2.8%
Mortgage Type
New Conventional
Estimated Equity
$1,043,423
Purchase Details
Closed on
Mar 1, 2019
Sold by
King Dannie C and Martin King Mary
Bought by
Raggo Clifford and Raggo Melissa
Home Financials for this Owner
Home Financials are based on the most recent Mortgage that was taken out on this home.
Original Mortgage
$632,000
Interest Rate
4.3%
Mortgage Type
New Conventional
Purchase Details
Closed on
Feb 6, 2006
Sold by
King Dannie C and Martin King Mary
Bought by
King Dannie C and Martin King Mary
Purchase Details
Closed on
Mar 1, 1985
Create a Home Valuation Report for This Property
The Home Valuation Report is an in-depth analysis detailing your home's value as well as a comparison with similar homes in the area
Home Values in the Area
Average Home Value in this Area
Purchase History
| Date | Buyer | Sale Price | Title Company |
|---|---|---|---|
| Raggo Clifford | -- | Corinthian Title | |
| Raggo Clifford | $790,000 | California Title Company | |
| King Dannie C | -- | None Available | |
| -- | $149,000 | -- |
Source: Public Records
Mortgage History
| Date | Status | Borrower | Loan Amount |
|---|---|---|---|
| Open | Raggo Clifford | $501,000 | |
| Closed | Raggo Clifford | $632,000 |
Source: Public Records
Tax History Compared to Growth
Tax History
| Year | Tax Paid | Tax Assessment Tax Assessment Total Assessment is a certain percentage of the fair market value that is determined by local assessors to be the total taxable value of land and additions on the property. | Land | Improvement |
|---|---|---|---|---|
| 2025 | $9,901 | $881,252 | $145,697 | $735,555 |
| 2024 | $9,901 | $863,974 | $142,841 | $721,133 |
| 2023 | $9,695 | $847,035 | $140,041 | $706,994 |
| 2022 | $9,537 | $830,428 | $137,296 | $693,132 |
| 2021 | $9,415 | $814,146 | $134,604 | $679,542 |
| 2020 | $9,290 | $805,799 | $133,224 | $672,575 |
| 2019 | $3,448 | $295,806 | $48,906 | $246,900 |
| 2018 | $3,355 | $290,007 | $47,948 | $242,059 |
| 2017 | $3,268 | $284,321 | $47,008 | $237,313 |
| 2016 | $3,203 | $278,747 | $46,087 | $232,660 |
| 2015 | $3,157 | $274,561 | $45,395 | $229,166 |
| 2014 | $3,086 | $269,183 | $44,506 | $224,677 |
Source: Public Records
Map
Nearby Homes
- 14152 Kendra Way
- 13730 Holly Oak Way
- 13760 Holly Oak Way
- 14403 Gaslight Ct
- 13958 Carriage Rd
- 13710 Ahwahnee Way
- 14259 Midland Rd
- 14001 Saddlewood Dr
- 12710 Treeridge Terrace
- 13785 Holly Oak Way
- 13770 Holly Oak Way
- 13852 Olive Mill Way
- 13765 Holly Oak Way
- 13979 Hickory St
- 14082 Pomegranate Ave Unit 146
- 000 Twin Peaks Rd Unit 18
- 14004 Jasmine Ave Unit 260
- 15123 Larchmont St
- 13403 Little Dawn Ln
- 13654 Somerset Rd
- 13239 Woodcreek Place
- 13234 Ironbark Way
- 14251 Woodcreek Rd
- 14259 Woodcreek Rd
- 13251 Woodcreek Place
- 13250 Ironbark Way
- 14267 Woodcreek Rd
- 13217 Woodcreek Place
- 13219 Ironbark Way
- 14243 Woodcreek Rd
- 13235 Ironbark Way
- 13252 Woodcreek Place
- 13205 Woodcreek Place
- 14235 Woodcreek Rd
- 14350 Gaelyn Ct
- 14342 Gaelyn Ct
- 13234 Alder Place
- 14358 Gaelyn Ct
- 13240 Woodcreek Place
- 13196 Woodmont St