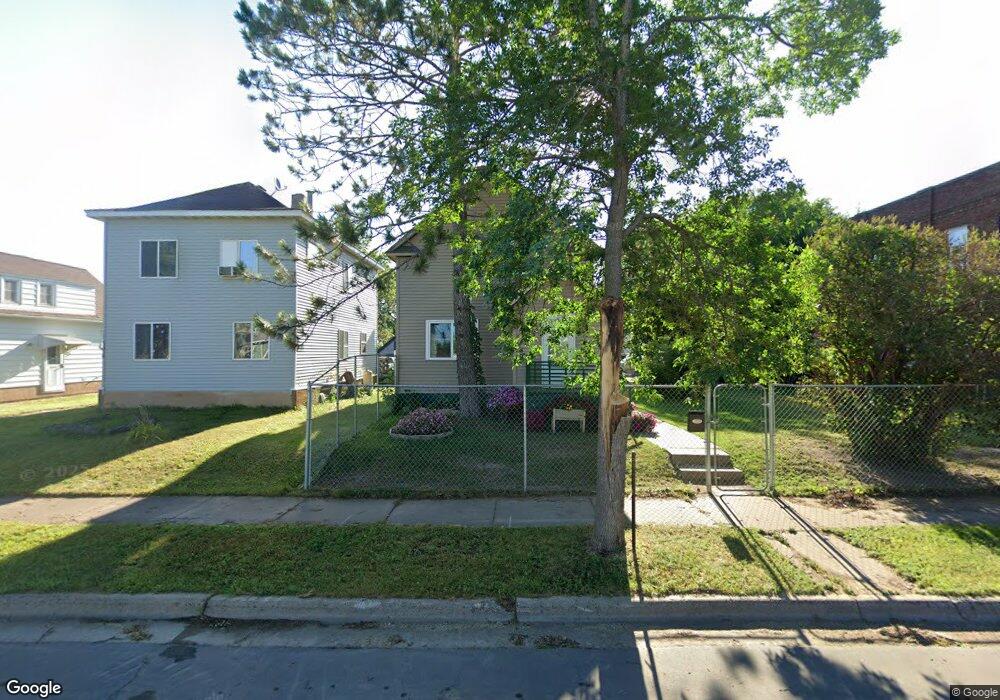
1322 13th Ave E Hibbing, MN 55746
Estimated Value: $123,000 - $180,000
3
Beds
2
Baths
1,648
Sq Ft
$89/Sq Ft
Est. Value
About This Home
This home is located at 1322 13th Ave E, Hibbing, MN 55746 and is currently estimated at $146,935, approximately $89 per square foot. 1322 13th Ave E is a home located in St. Louis County with nearby schools including Washington Elementary School, Lincoln Elementary School, and Hibbing High School.
Ownership History
Date
Name
Owned For
Owner Type
Purchase Details
Closed on
Jun 10, 2025
Sold by
Ej Rentals Llc
Bought by
Vesel Rentals Llc
Current Estimated Value
Purchase Details
Closed on
Mar 16, 2016
Sold by
Vesel Edward and Vesel Joyce
Bought by
E J Rentals Llc
Purchase Details
Closed on
Sep 19, 2011
Sold by
Vesel Edward and Wirtanen Joyce
Bought by
Wentz Michael Raymond and Borgman Amber Lynn
Purchase Details
Closed on
Jun 30, 2011
Sold by
Mpr Partnership
Bought by
Vesel Edward and Wirtanen Joyce
Purchase Details
Closed on
Sep 2, 2005
Sold by
Vizenor Lloyd P
Bought by
Mpr Partnership
Home Financials for this Owner
Home Financials are based on the most recent Mortgage that was taken out on this home.
Original Mortgage
$20,000
Interest Rate
5.93%
Mortgage Type
Purchase Money Mortgage
Purchase Details
Closed on
May 10, 2005
Sold by
Vizenor Cecilla M
Bought by
Vizenor Lloyd P
Create a Home Valuation Report for This Property
The Home Valuation Report is an in-depth analysis detailing your home's value as well as a comparison with similar homes in the area
Home Values in the Area
Average Home Value in this Area
Purchase History
| Date | Buyer | Sale Price | Title Company |
|---|---|---|---|
| Vesel Rentals Llc | $500 | None Listed On Document | |
| E J Rentals Llc | $76,744 | Attorney | |
| Wentz Michael Raymond | $89,000 | All American | |
| Vesel Edward | $41,000 | All American | |
| Mpr Partnership | $24,000 | -- | |
| Vizenor Lloyd P | -- | Commonwealth Title |
Source: Public Records
Mortgage History
| Date | Status | Borrower | Loan Amount |
|---|---|---|---|
| Previous Owner | Mpr Partnership | $20,000 | |
| Closed | Wentz Michael Raymond | $0 |
Source: Public Records
Tax History
| Year | Tax Paid | Tax Assessment Tax Assessment Total Assessment is a certain percentage of the fair market value that is determined by local assessors to be the total taxable value of land and additions on the property. | Land | Improvement |
|---|---|---|---|---|
| 2024 | $782 | $115,200 | $12,500 | $102,700 |
| 2023 | $782 | $90,100 | $10,400 | $79,700 |
| 2022 | $574 | $96,100 | $10,400 | $85,700 |
| 2021 | $516 | $77,600 | $10,400 | $67,200 |
| 2020 | $508 | $74,700 | $10,400 | $64,300 |
| 2019 | $496 | $74,700 | $10,400 | $64,300 |
| 2018 | $348 | $74,700 | $10,400 | $64,300 |
| 2017 | $334 | $63,200 | $10,500 | $52,700 |
| 2016 | $1,032 | $63,200 | $10,500 | $52,700 |
| 2015 | $622 | $66,800 | $10,500 | $56,300 |
| 2014 | $622 | $37,900 | $11,500 | $26,400 |
Source: Public Records
Map
Nearby Homes
- 1326 13th Ave E
- 1320 13th Ave E
- 1320 13th Ave E
- 1330 13th Ave E
- 1316 13th Ave E
- 1312 13th Ave E
- 1323 14th Ave E
- 1319 14th Ave E
- 1327 14th Ave E
- 1317 14th Ave E
- 1329 14th Ave E
- 1402 13th Ave E
- 1317 13th Ave E
- 1313 14th Ave E
- 1327 13th Ave E
- 1315 13th Ave E
- 1329 13th Ave E
- 1404 13th Ave E
- 1404 13th Ave E Unit 1404 1/2 13th Ave E
- 1313 13th Ave E
Your Personal Tour Guide
Ask me questions while you tour the home.