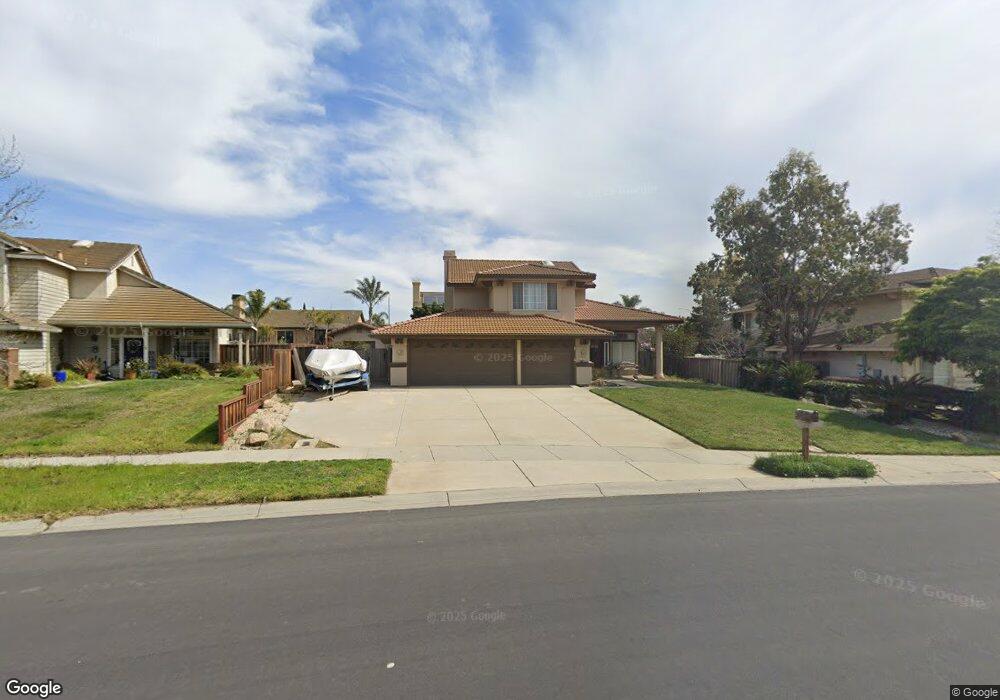
1322 Appalachian St Soledad, CA 93960
Estimated Value: $710,000 - $722,185
4
Beds
3
Baths
2,092
Sq Ft
$343/Sq Ft
Est. Value
About This Home
This home is located at 1322 Appalachian St, Soledad, CA 93960 and is currently estimated at $718,046, approximately $343 per square foot. 1322 Appalachian St is a home located in Monterey County with nearby schools including Rose Ferrero Elementary School, Main Street Middle School, and Soledad High School.
Ownership History
Date
Name
Owned For
Owner Type
Purchase Details
Closed on
Nov 19, 2024
Sold by
Miranda Stella M
Bought by
Stella Miranda Revocable Trust and Miranda
Current Estimated Value
Purchase Details
Closed on
Nov 25, 2017
Sold by
Miranda Stella M
Bought by
Miranda Stella M
Home Financials for this Owner
Home Financials are based on the most recent Mortgage that was taken out on this home.
Original Mortgage
$183,200
Interest Rate
3.93%
Mortgage Type
New Conventional
Purchase Details
Closed on
Dec 9, 2004
Sold by
Gomez Jose G and Gomez Stella M
Bought by
Miranda Stella
Purchase Details
Closed on
Jun 26, 1996
Sold by
South County Homes Ii
Bought by
Gomez Jose G and Gomez Stella M
Home Financials for this Owner
Home Financials are based on the most recent Mortgage that was taken out on this home.
Original Mortgage
$186,840
Interest Rate
7.54%
Create a Home Valuation Report for This Property
The Home Valuation Report is an in-depth analysis detailing your home's value as well as a comparison with similar homes in the area
Home Values in the Area
Average Home Value in this Area
Purchase History
| Date | Buyer | Sale Price | Title Company |
|---|---|---|---|
| Stella Miranda Revocable Trust | -- | None Listed On Document | |
| Miranda Stella M | -- | Title 365 | |
| Miranda Stella | -- | -- | |
| Gomez Jose G | $234,000 | Chicago Title |
Source: Public Records
Mortgage History
| Date | Status | Borrower | Loan Amount |
|---|---|---|---|
| Previous Owner | Miranda Stella M | $183,200 | |
| Previous Owner | Gomez Jose G | $186,840 |
Source: Public Records
Tax History Compared to Growth
Tax History
| Year | Tax Paid | Tax Assessment Tax Assessment Total Assessment is a certain percentage of the fair market value that is determined by local assessors to be the total taxable value of land and additions on the property. | Land | Improvement |
|---|---|---|---|---|
| 2025 | $4,603 | $372,906 | $79,829 | $293,077 |
| 2024 | $4,603 | $365,595 | $78,264 | $287,331 |
| 2023 | $4,170 | $358,428 | $76,730 | $281,698 |
| 2022 | $4,229 | $351,401 | $75,226 | $276,175 |
| 2021 | $4,088 | $344,511 | $73,751 | $270,760 |
| 2020 | $4,023 | $340,979 | $72,995 | $267,984 |
| 2019 | $3,932 | $334,294 | $71,564 | $262,730 |
| 2018 | $3,988 | $327,740 | $70,161 | $257,579 |
| 2017 | $3,848 | $321,315 | $68,786 | $252,529 |
| 2016 | $3,675 | $315,016 | $67,438 | $247,578 |
| 2015 | $3,622 | $310,286 | $66,426 | $243,860 |
| 2014 | $3,605 | $304,209 | $65,125 | $239,084 |
Source: Public Records
Map
Nearby Homes
- 620 Verano St
- 715 Skinner St
- 387 Anderson St
- 1037 Vista Ave
- 950 Prado Dr
- 641 Main St
- 1148 La Colina St
- 1233 La Colina St
- 1278 San Antonio St
- 1306 San Antonio St
- 518 Main St
- 35095 Metz Rd
- 236 West St
- 523 Calle Valverde
- 617 Aromas Place
- 0 California 146
- 201 Park St
- 31102 Camphora Gloria Rd
- 35700 Eagle Ridge
- 30625 Stonewall Canyon Rd
- 1354 Appalachian St
- 1300 Appalachian St
- 1315 Ridgeview Ct
- 1303 Ridgeview Ct
- 1327 Ridgeview Ct
- 1359 Ridgeview Ct
- 1376 Appalachian St
- 1353 Appalachian St
- 1307 Appalachian St
- 370 Valleyridge St
- 366 Valleyridge St
- 378 Valleyridge St
- 1395 Appalachian St
- 1371 Ridgeview Ct
- 1390 Appalachian St
- 360 Valleyridge St
- 369 Valleyridge St
- 380 Valleyridge St
- 1314 Ridgeview Ct
- 1302 Ridgeview Ct