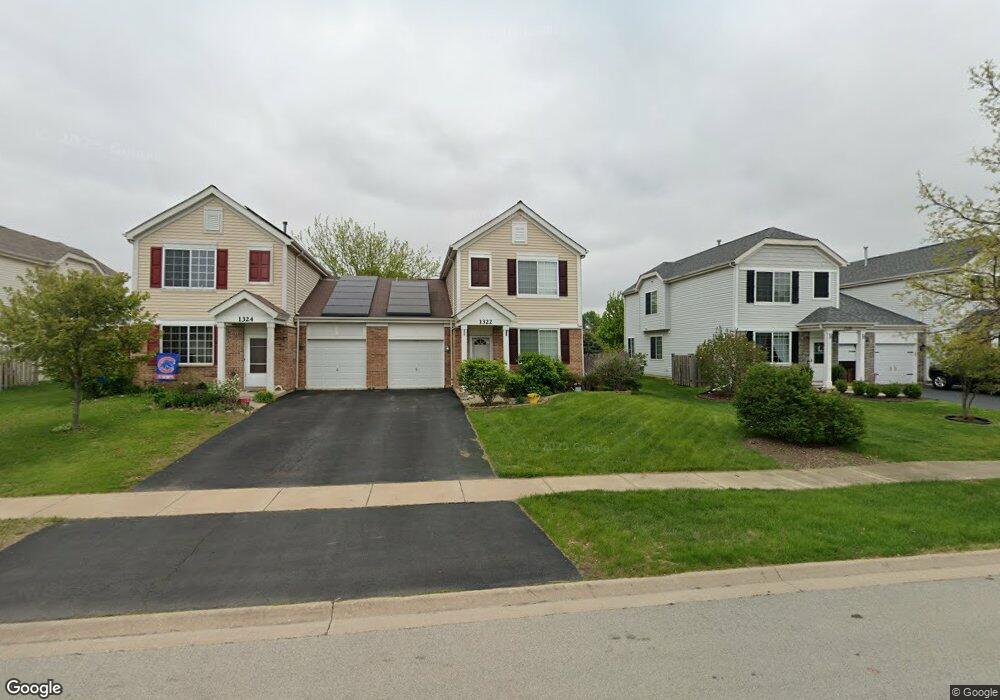
1322 Kettleson Dr Unit 1 Minooka, IL 60447
North Minooka NeighborhoodEstimated Value: $278,000 - $283,000
3
Beds
3
Baths
1,500
Sq Ft
$187/Sq Ft
Est. Value
About This Home
This home is located at 1322 Kettleson Dr Unit 1, Minooka, IL 60447 and is currently estimated at $280,819, approximately $187 per square foot. 1322 Kettleson Dr Unit 1 is a home located in Kendall County with nearby schools including Jones Elementary School, Minooka Junior High School, and Minooka Intermediate School.
Ownership History
Date
Name
Owned For
Owner Type
Purchase Details
Closed on
Jun 19, 2019
Sold by
Kath Ryan A and Kath Emily J
Bought by
Burback Connie
Current Estimated Value
Home Financials for this Owner
Home Financials are based on the most recent Mortgage that was taken out on this home.
Original Mortgage
$173,401
Outstanding Balance
$156,459
Interest Rate
5.5%
Mortgage Type
FHA
Estimated Equity
$124,360
Purchase Details
Closed on
Apr 1, 2010
Sold by
Lorig Peggy
Bought by
Federal National Mortgage Association
Purchase Details
Closed on
Oct 25, 2007
Sold by
Gmac Model Home Finance Llc
Bought by
Kath Ryan A and Kath Emily J
Home Financials for this Owner
Home Financials are based on the most recent Mortgage that was taken out on this home.
Original Mortgage
$162,400
Interest Rate
6.45%
Mortgage Type
FHA
Purchase Details
Closed on
Oct 26, 2006
Sold by
Summerfield Venture Llc
Bought by
Gmac Model Home Finance Llc
Create a Home Valuation Report for This Property
The Home Valuation Report is an in-depth analysis detailing your home's value as well as a comparison with similar homes in the area
Home Values in the Area
Average Home Value in this Area
Purchase History
| Date | Buyer | Sale Price | Title Company |
|---|---|---|---|
| Burback Connie | $177,000 | Carrington Ttl Partners Llc | |
| Federal National Mortgage Association | $160,631 | None Available | |
| Kath Ryan A | $179,000 | North American Title | |
| Gmac Model Home Finance Llc | $353,000 | North American Title |
Source: Public Records
Mortgage History
| Date | Status | Borrower | Loan Amount |
|---|---|---|---|
| Open | Burback Connie | $173,401 | |
| Previous Owner | Kath Ryan A | $162,400 |
Source: Public Records
Tax History
| Year | Tax Paid | Tax Assessment Tax Assessment Total Assessment is a certain percentage of the fair market value that is determined by local assessors to be the total taxable value of land and additions on the property. | Land | Improvement |
|---|---|---|---|---|
| 2024 | $5,933 | $77,356 | $11,506 | $65,850 |
| 2023 | $4,585 | $67,739 | $7,481 | $60,258 |
| 2022 | $4,585 | $59,931 | $6,927 | $53,004 |
| 2021 | $4,436 | $56,705 | $7,032 | $49,673 |
| 2020 | $4,493 | $55,336 | $6,862 | $48,474 |
| 2019 | $4,624 | $49,422 | $6,862 | $42,560 |
| 2018 | $4,285 | $46,903 | $6,512 | $40,391 |
| 2017 | $4,145 | $42,766 | $6,512 | $36,254 |
| 2016 | $3,872 | $39,629 | $6,432 | $33,197 |
| 2015 | $2,975 | $36,190 | $6,105 | $30,085 |
| 2014 | -- | $37,995 | $6,105 | $31,890 |
| 2013 | -- | $37,995 | $6,105 | $31,890 |
Source: Public Records
Map
Nearby Homes
- 1308 Kettleson Dr
- 622 Gallant Dr
- 1510 Balboa Dr
- 1529 Balboa Dr Unit 2A
- Lot 1 Minooka Ridge & Jones Rd
- 2041 Isabella Ln
- LOT 1 Bob Blair Rd
- 701 Davidson Dr Unit B
- 405 W Mondamin St
- 214 Deerpath Dr
- 204 N Wabasso St
- 105 Blackhawk Dr
- 2037 Isabella Ln
- 6010-6060 E Minooka Rd
- 706 O Toole Dr
- 517 Rivers Edge Dr
- 521 Rivers Edge Dr
- 103 Northfield Dr
- LOT 28 O Toole Dr
- VL Mcevilly Rd
- 1322 Kettleson Dr
- 1324 Kettleson Dr
- 1324 Kettleson Dr Unit 1
- 1320 Kettleson Dr
- 1326 Kettleson Dr
- 1318 Kettleson Dr
- 1328 Kettleson Dr
- 1316 Kettleson Dr
- 1316 Kettleson Dr Unit 249
- 1400 Kettleson Dr
- 1400 Kettleson Dr Unit 245R
- 1314 Kettleson Dr
- 1402 Kettleson Dr
- 1402 Kettleson Dr Unit 1402
- 1402 Kettleson Dr Unit 245L
- 1312 Kettleson Dr
- 603 Tremont Dr
- 1404 Kettleson Dr
- 1310 Kettleson Dr
- 1406 Kettleson Dr
Your Personal Tour Guide
Ask me questions while you tour the home.