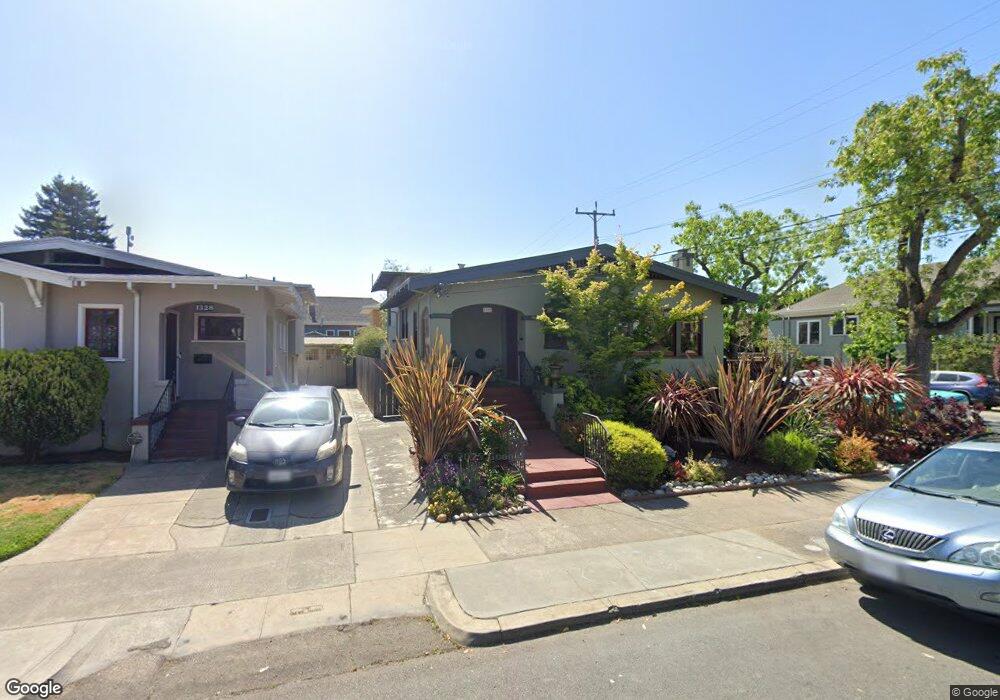
1322 Regent St Alameda, CA 94501
Downtown Alameda NeighborhoodEstimated Value: $916,000 - $1,366,000
2
Beds
2
Baths
1,200
Sq Ft
$931/Sq Ft
Est. Value
About This Home
This home is located at 1322 Regent St, Alameda, CA 94501 and is currently estimated at $1,117,149, approximately $930 per square foot. 1322 Regent St is a home located in Alameda County with nearby schools including Edison Elementary School, Lincoln Middle School, and Alameda High School.
Ownership History
Date
Name
Owned For
Owner Type
Purchase Details
Closed on
Sep 23, 2010
Sold by
Dunn Bradley J and Dunn Shelly A
Bought by
Dunn Bradley J and Dunn Shelly A
Current Estimated Value
Purchase Details
Closed on
Nov 6, 2003
Sold by
Dunn Bradley J and Dunn Shelly A
Bought by
The Bradley & Shelly Dunn 2003 Revocable
Purchase Details
Closed on
Mar 21, 2001
Sold by
Ingram Jayson Lynn and Dehaan Ingram Jill Gail
Bought by
Dunn Bradley J and Dunn Shelly A
Home Financials for this Owner
Home Financials are based on the most recent Mortgage that was taken out on this home.
Original Mortgage
$300,000
Outstanding Balance
$108,830
Interest Rate
6.97%
Estimated Equity
$1,008,319
Purchase Details
Closed on
May 15, 1996
Sold by
Barron Sally Jo
Bought by
Ingram Jayson Lynn and Dehaan Ingram Jill Gail
Home Financials for this Owner
Home Financials are based on the most recent Mortgage that was taken out on this home.
Original Mortgage
$166,500
Interest Rate
8.07%
Create a Home Valuation Report for This Property
The Home Valuation Report is an in-depth analysis detailing your home's value as well as a comparison with similar homes in the area
Home Values in the Area
Average Home Value in this Area
Purchase History
| Date | Buyer | Sale Price | Title Company |
|---|---|---|---|
| Dunn Bradley J | -- | None Available | |
| Dunn Bradley J | -- | None Available | |
| The Bradley & Shelly Dunn 2003 Revocable | -- | -- | |
| Dunn Bradley J | $435,000 | First American Title Guarant | |
| Ingram Jayson Lynn | $185,000 | North American Title Co |
Source: Public Records
Mortgage History
| Date | Status | Borrower | Loan Amount |
|---|---|---|---|
| Open | Dunn Bradley J | $300,000 | |
| Previous Owner | Ingram Jayson Lynn | $166,500 |
Source: Public Records
Tax History
| Year | Tax Paid | Tax Assessment Tax Assessment Total Assessment is a certain percentage of the fair market value that is determined by local assessors to be the total taxable value of land and additions on the property. | Land | Improvement |
|---|---|---|---|---|
| 2025 | $9,560 | $648,427 | $196,628 | $458,799 |
| 2024 | $9,560 | $635,577 | $192,773 | $449,804 |
| 2023 | $9,196 | $629,980 | $188,994 | $440,986 |
| 2022 | $8,988 | $610,630 | $185,289 | $432,341 |
| 2021 | $8,767 | $598,520 | $181,656 | $423,864 |
| 2020 | $8,659 | $599,311 | $179,793 | $419,518 |
| 2019 | $8,260 | $587,562 | $176,268 | $411,294 |
| 2018 | $8,053 | $576,044 | $172,813 | $403,231 |
| 2017 | $7,684 | $564,751 | $169,425 | $395,326 |
| 2016 | $7,691 | $553,680 | $166,104 | $387,576 |
| 2015 | $7,664 | $545,367 | $163,610 | $381,757 |
| 2014 | $7,316 | $534,688 | $160,406 | $374,282 |
Source: Public Records
Map
Nearby Homes
- 1354 Regent St
- 2608 Central Ave
- 2515 Central Ave Unit 203
- 2417 Marti Rae Ct
- 1241 Park Ave
- 1251 Park St
- 2312 San Antonio Ave
- 1416 Versailles Ave
- 1601 Broadway Unit 9
- 976 Park St
- 954 Park St
- 1100 Park Ave
- 1308 Court St
- 1611 Lea Ct
- 2118 Alameda Ave
- 2136 Pacific Ave
- 3248 Briggs Ave
- 2819 Bayview Dr
- 2137 Otis Dr Unit 111
- 2106 Otis Dr Unit A
- 1328 Regent St
- 2507 Chester St
- 1332 Regent St
- 1316 Regent St
- 2511 Chester St
- 1336 Regent St
- 1312 Regent St
- 2513 Chester St
- 2508 Chester St
- 1338 Regent St
- 1325 Regent St
- 1329 Regent St
- 2510 Chester St
- 1308 Regent St
- 1317 Regent St
- 2515 Chester St
- 1342 Regent St
- 2512 Chester St
- 1315 Regent St
- 2510 Crist St
Your Personal Tour Guide
Ask me questions while you tour the home.