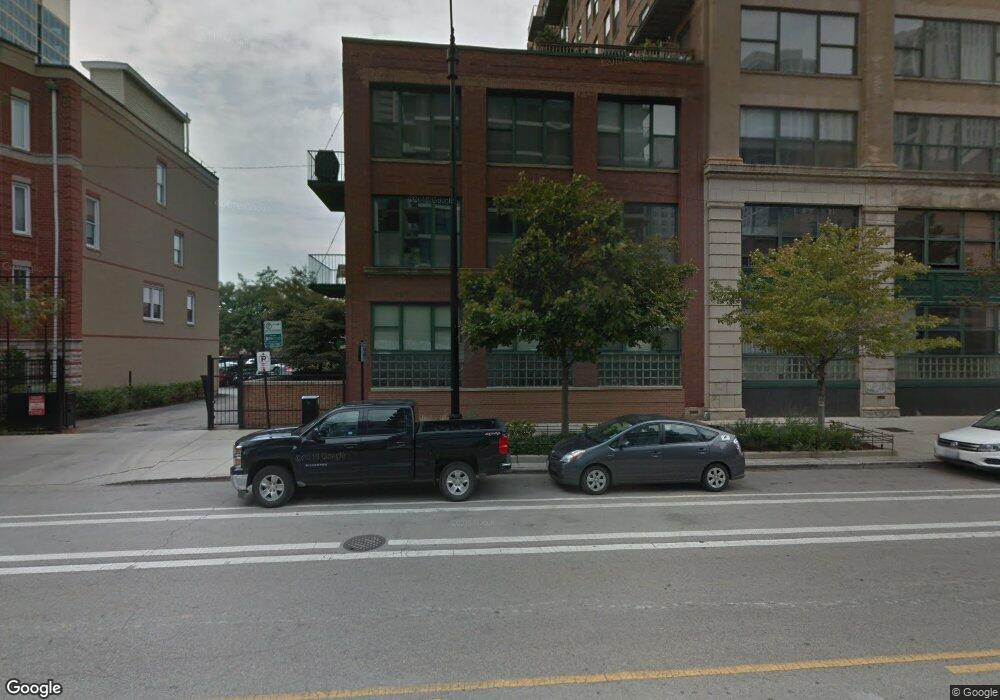
1322 S Wabash Ave Unit W8 Chicago, IL 60605
South Loop NeighborhoodEstimated Value: $139,735 - $388,000
--
Bed
--
Bath
--
Sq Ft
1.03
Acres
About This Home
This home is located at 1322 S Wabash Ave Unit W8, Chicago, IL 60605 and is currently estimated at $245,684. 1322 S Wabash Ave Unit W8 is a home located in Cook County with nearby schools including South Loop Elementary School, Wendell Phillips Academy High School, and Old St. Marys School.
Ownership History
Date
Name
Owned For
Owner Type
Purchase Details
Closed on
Jun 25, 2021
Sold by
Hansen James C
Bought by
Hansen James C and Hansen Blaine
Current Estimated Value
Home Financials for this Owner
Home Financials are based on the most recent Mortgage that was taken out on this home.
Original Mortgage
$155,600
Outstanding Balance
$118,312
Interest Rate
2.62%
Mortgage Type
New Conventional
Estimated Equity
$127,372
Purchase Details
Closed on
Nov 2, 2012
Sold by
Rowland Jennifer L
Bought by
Hansen James C
Home Financials for this Owner
Home Financials are based on the most recent Mortgage that was taken out on this home.
Original Mortgage
$185,250
Interest Rate
3.3%
Mortgage Type
New Conventional
Purchase Details
Closed on
Oct 2, 1996
Sold by
Powell Frederick H
Bought by
American National Bk & Tr Co Of Chicago and Trust #118865-04
Create a Home Valuation Report for This Property
The Home Valuation Report is an in-depth analysis detailing your home's value as well as a comparison with similar homes in the area
Home Values in the Area
Average Home Value in this Area
Purchase History
| Date | Buyer | Sale Price | Title Company |
|---|---|---|---|
| Hansen James C | -- | Bchh Inc | |
| Hansen James C | $195,000 | None Available | |
| American National Bk & Tr Co Of Chicago | -- | -- |
Source: Public Records
Mortgage History
| Date | Status | Borrower | Loan Amount |
|---|---|---|---|
| Open | Hansen James C | $155,600 | |
| Previous Owner | Hansen James C | $185,250 |
Source: Public Records
Tax History Compared to Growth
Tax History
| Year | Tax Paid | Tax Assessment Tax Assessment Total Assessment is a certain percentage of the fair market value that is determined by local assessors to be the total taxable value of land and additions on the property. | Land | Improvement |
|---|---|---|---|---|
| 2024 | $317 | $2,341 | $564 | $1,777 |
| 2023 | $309 | $1,500 | $454 | $1,046 |
| 2022 | $309 | $1,500 | $454 | $1,046 |
| 2021 | $302 | $1,499 | $453 | $1,046 |
| 2020 | $430 | $1,928 | $372 | $1,556 |
| 2019 | $422 | $2,099 | $372 | $1,727 |
| 2018 | $415 | $2,099 | $372 | $1,727 |
| 2017 | $373 | $1,735 | $307 | $1,428 |
| 2016 | $348 | $1,735 | $307 | $1,428 |
| 2015 | $318 | $1,735 | $307 | $1,428 |
| 2014 | $319 | $1,719 | $275 | $1,444 |
| 2013 | $313 | $1,719 | $275 | $1,444 |
Source: Public Records
Map
Nearby Homes
- 1322 S Wabash Ave Unit 807
- 1346 S Wabash Ave Unit A
- 1345 S Wabash Ave Unit 606
- 1345 S Wabash Ave Unit 1603
- 1345 S Wabash Ave Unit 1408
- 1345 S Wabash Ave Unit 1501
- 1307 S Wabash Ave Unit 312
- 1307 S Wabash Ave Unit 308
- 1400 S Michigan Ave Unit 2801
- 1400 S Michigan Ave Unit 1003
- 1400 S Michigan Ave Unit 704
- 1400 S Michigan Ave Unit 1609
- 1243 S Wabash Ave Unit 302
- 1243 S Wabash Ave Unit 401
- 1250 S Michigan Ave Unit 1400
- 1250 S Michigan Ave Unit 2204
- 1250 S Michigan Ave Unit 2900
- 1250 S Michigan Ave Unit 907
- 1250 S Michigan Ave Unit 1007
- 1250 S Michigan Ave Unit 2704
- 1322 S Wabash Ave Unit S19
- 1322 S Wabash Ave Unit M1
- 1322 S Wabash Ave Unit C16
- 1322 S Wabash Ave Unit A14
- 1322 S Wabash Ave Unit R1
- 1322 S Wabash Ave Unit A7
- 1322 S Wabash Ave Unit W10
- 1322 S Wabash Ave Unit W9
- 1322 S Wabash Ave Unit W7
- 1322 S Wabash Ave Unit W6
- 1322 S Wabash Ave Unit W5
- 1322 S Wabash Ave Unit W4
- 1322 S Wabash Ave Unit W3
- 1322 S Wabash Ave Unit W2
- 1322 S Wabash Ave Unit W1
- 1322 S Wabash Ave Unit S21
- 1322 S Wabash Ave Unit S20
- 1322 S Wabash Ave Unit S18
- 1322 S Wabash Ave Unit S17
- 1322 S Wabash Ave Unit S16