Estimated Value: $906,273 - $1,041,000
4
Beds
3
Baths
1,784
Sq Ft
$542/Sq Ft
Est. Value
About This Home
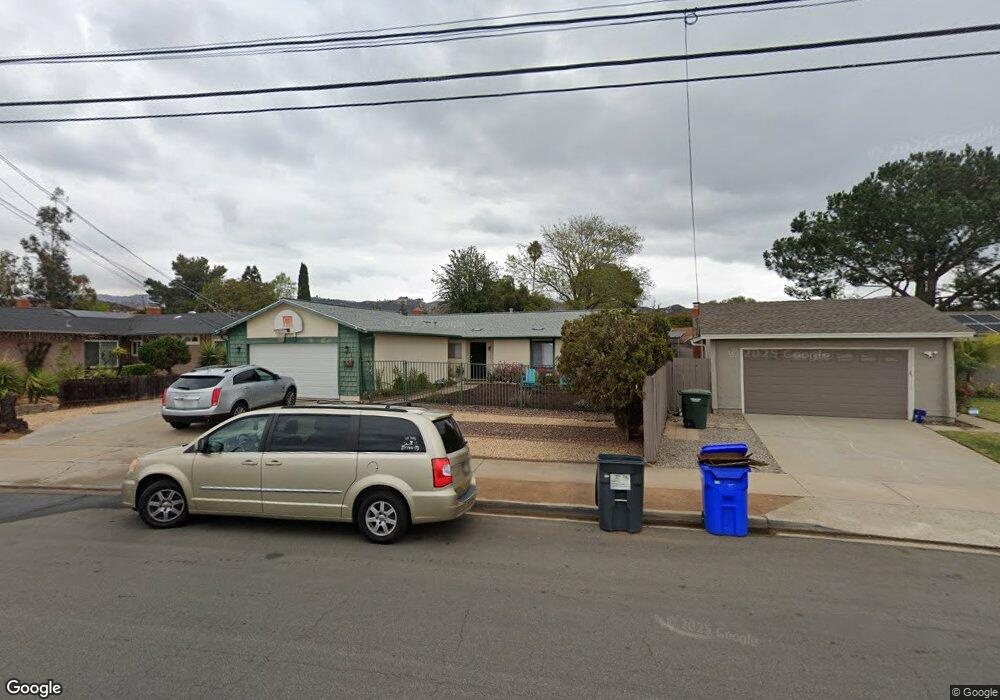
This home is located at 13227 Neddick Ave, Poway, CA 92064 and is currently estimated at $967,568, approximately $542 per square foot. 13227 Neddick Ave is a home located in San Diego County with nearby schools including Garden Road Elementary, Twin Peaks Middle, and Poway High.
Ownership History
Date
Name
Owned For
Owner Type
Purchase Details
Closed on
May 26, 2021
Sold by
Jones Philip E
Bought by
Jones Philip E and The Phillip E Jones Family Tru
Current Estimated Value
Purchase Details
Closed on
Sep 21, 2006
Sold by
Jones Philip E and Rose Polly
Bought by
Jones Philip E
Home Financials for this Owner
Home Financials are based on the most recent Mortgage that was taken out on this home.
Original Mortgage
$200,000
Outstanding Balance
$119,189
Interest Rate
6.53%
Mortgage Type
New Conventional
Estimated Equity
$848,379
Purchase Details
Closed on
Feb 23, 2000
Sold by
Philip Jones and Polly Rose
Bought by
Jones Philip E and Rose Polly
Purchase Details
Closed on
Jul 1, 1992
Purchase Details
Closed on
Jul 29, 1983
Create a Home Valuation Report for This Property
The Home Valuation Report is an in-depth analysis detailing your home's value as well as a comparison with similar homes in the area
Home Values in the Area
Average Home Value in this Area
Purchase History
| Date | Buyer | Sale Price | Title Company |
|---|---|---|---|
| Jones Philip E | -- | None Available | |
| Jones Philip E | -- | First American Title Co | |
| Jones Philip E | -- | Lawyers Title | |
| -- | $185,000 | -- | |
| -- | $83,500 | -- |
Source: Public Records
Mortgage History
| Date | Status | Borrower | Loan Amount |
|---|---|---|---|
| Open | Jones Philip E | $200,000 |
Source: Public Records
Tax History
| Year | Tax Paid | Tax Assessment Tax Assessment Total Assessment is a certain percentage of the fair market value that is determined by local assessors to be the total taxable value of land and additions on the property. | Land | Improvement |
|---|---|---|---|---|
| 2025 | $3,625 | $320,697 | $130,008 | $190,689 |
| 2024 | $3,625 | $314,409 | $127,459 | $186,950 |
| 2023 | $3,549 | $308,245 | $124,960 | $183,285 |
| 2022 | $3,491 | $302,202 | $122,510 | $179,692 |
| 2021 | $3,447 | $296,277 | $120,108 | $176,169 |
| 2020 | $3,401 | $293,240 | $118,877 | $174,363 |
| 2019 | $3,315 | $287,492 | $116,547 | $170,945 |
| 2018 | $3,224 | $281,856 | $114,262 | $167,594 |
| 2017 | $170 | $276,330 | $112,022 | $164,308 |
| 2016 | $3,075 | $270,913 | $109,826 | $161,087 |
| 2015 | $3,031 | $266,845 | $108,177 | $158,668 |
| 2014 | $2,962 | $261,618 | $106,058 | $155,560 |
Source: Public Records
Map
Nearby Homes
- 13209 Neddick Ave
- 14525 Kittery St
- 13419 Sebago Ave
- 13428 Standish Dr
- 13001 Standish Dr
- 14610 Fairburn St
- 13435 Frey Ct
- 12671 Claire Dr
- 14550 Dehia St
- 14298 Ipava Dr
- 13735 Fairgate Dr
- 13643 Melissa Ln
- 13746 Paseo Bonita
- 000 Carlson Ct 9 Unit 9
- 14003 Jasmine Ave Unit 193
- 14089 Pomegranate Ave Unit 214
- 13908 Hibiscus Ave Unit 40
- 13941 Wisteria Ave
- 13947 Midland Rd
- 13422 Little Dawn Ln
- 13221 Neddick Ave
- 13233 Neddick Ave
- 13244 Waltham Ave
- 13215 Neddick Ave
- 13238 Waltham Ave
- 14411 Garden Rd
- 14407 Garden Rd
- 13250 Waltham Ave
- 13220 Neddick Ave
- 14415 Garden Rd
- 13232 Waltham Ave
- 13214 Neddick Ave
- 14421 Garden Rd
- 13226 Neddick Ave
- 13238 Neddick Ave
- 13232 Neddick Ave
- 13208 Neddick Ave
- 13203 Neddick Ave
- 13249 Waltham Ave
- 13226 Waltham Ave
Your Personal Tour Guide
Ask me questions while you tour the home.