13228 Peacock Ct Cupertino, CA 95014
Estimated Value: $4,465,797 - $5,635,000
4
Beds
4
Baths
4,291
Sq Ft
$1,196/Sq Ft
Est. Value
About This Home
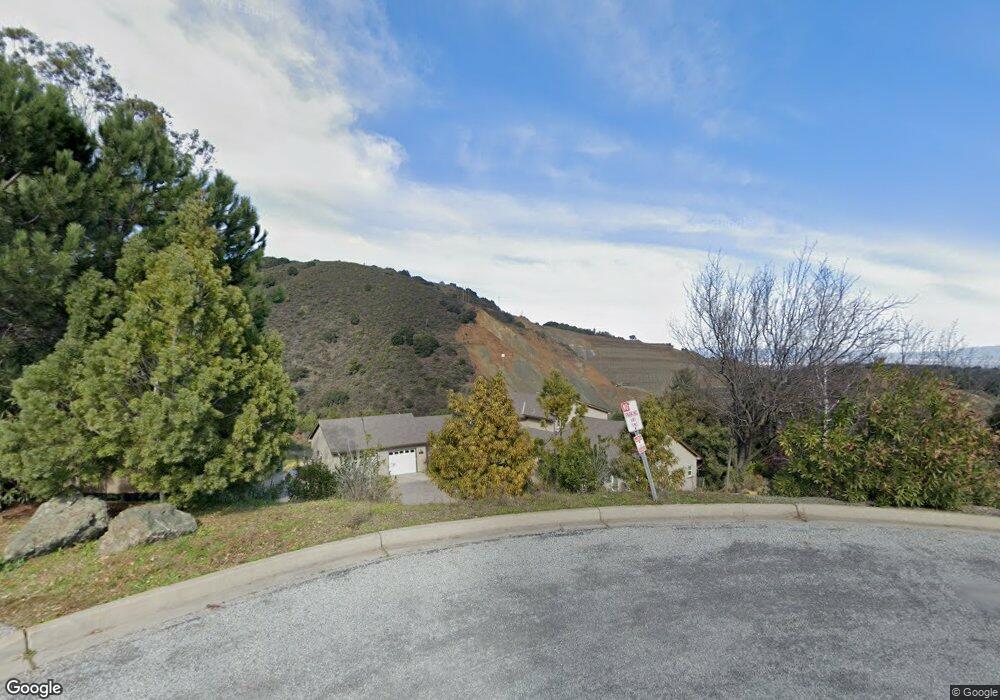
This home is located at 13228 Peacock Ct, Cupertino, CA 95014 and is currently estimated at $5,131,449, approximately $1,195 per square foot. 13228 Peacock Ct is a home located in Santa Clara County with nearby schools including Blue Hills Elementary School, John F. Kennedy Middle School, and Monta Vista High School.
Ownership History
Date
Name
Owned For
Owner Type
Purchase Details
Closed on
Jul 10, 2017
Sold by
Gallo Paul C
Bought by
Gallo Paul C
Current Estimated Value
Purchase Details
Closed on
Jun 29, 2017
Sold by
Stevens Creek Quarry Inc
Bought by
Stevens Creek Quarry Inc
Purchase Details
Closed on
Jun 14, 2017
Sold by
Gallo Paul C
Bought by
Stevens Creek Quarry Inc
Purchase Details
Closed on
Mar 16, 2012
Sold by
Gallo Paul
Bought by
Gallo Paul C
Purchase Details
Closed on
Aug 1, 2006
Sold by
Gallo Paul C
Bought by
Gallo Paul C
Purchase Details
Closed on
Aug 6, 2003
Sold by
Gallo Paul C
Bought by
Gallo Paul C and Gallo Mildred
Home Financials for this Owner
Home Financials are based on the most recent Mortgage that was taken out on this home.
Original Mortgage
$960,000
Interest Rate
5.13%
Mortgage Type
Purchase Money Mortgage
Purchase Details
Closed on
Jul 24, 2003
Sold by
Gallo Mildred
Bought by
Gallo Paul C
Home Financials for this Owner
Home Financials are based on the most recent Mortgage that was taken out on this home.
Original Mortgage
$960,000
Interest Rate
5.13%
Mortgage Type
Purchase Money Mortgage
Purchase Details
Closed on
Jun 25, 2002
Sold by
Gallo Paul C and Gallo Mildred
Bought by
Gallo Paul C and Gallo Mildred
Home Financials for this Owner
Home Financials are based on the most recent Mortgage that was taken out on this home.
Original Mortgage
$973,400
Interest Rate
6.78%
Mortgage Type
Purchase Money Mortgage
Purchase Details
Closed on
Jul 22, 1998
Sold by
Gallo Mildred
Bought by
Gallo Mildred
Home Financials for this Owner
Home Financials are based on the most recent Mortgage that was taken out on this home.
Original Mortgage
$1,000,000
Interest Rate
6.9%
Mortgage Type
Purchase Money Mortgage
Purchase Details
Closed on
Jul 21, 1998
Sold by
Lynam Cathy A
Bought by
Gallo Paul C and Gallo Mildred
Home Financials for this Owner
Home Financials are based on the most recent Mortgage that was taken out on this home.
Original Mortgage
$1,000,000
Interest Rate
6.9%
Mortgage Type
Purchase Money Mortgage
Purchase Details
Closed on
Jun 15, 1994
Sold by
Lynam Bryan Joseph and Lynam Cathy Ann
Bought by
Lynam Bryan Joseph and Lynam Cathy Ann
Purchase Details
Closed on
May 24, 1994
Sold by
County Santa Clara
Bought by
Lynam Bryan Joseph and Lynam Cathy Ann
Create a Home Valuation Report for This Property
The Home Valuation Report is an in-depth analysis detailing your home's value as well as a comparison with similar homes in the area
Purchase History
| Date | Buyer | Sale Price | Title Company |
|---|---|---|---|
| Gallo Paul C | -- | Old Republic Title Company | |
| Stevens Creek Quarry Inc | -- | Old Republic Title Company | |
| Stevens Creek Quarry Inc | $15,000 | Accommodation | |
| Gallo Paul C | -- | First American Title Company | |
| Gallo Paul C | -- | First American Title Company | |
| Gallo Paul C | -- | First American Title Company | |
| Gallo Paul C | -- | None Available | |
| Gallo Paul C | -- | None Available | |
| Gallo Paul C | $298,000 | -- | |
| Gallo Paul C | -- | Chicago Title | |
| Gallo Paul C | -- | First American Title Guarant | |
| Gallo Mildred | -- | -- | |
| Gallo Paul C | $1,699,000 | Chicago Title Co | |
| Lynam Bryan Joseph | -- | Valley Title Company | |
| Lynam Bryan Joseph | $261,500 | Valley Title Company |
Source: Public Records
Mortgage History
| Date | Status | Borrower | Loan Amount |
|---|---|---|---|
| Previous Owner | Gallo Paul C | $960,000 | |
| Previous Owner | Gallo Paul C | $973,400 | |
| Previous Owner | Gallo Paul C | $1,000,000 |
Source: Public Records
Tax History
| Year | Tax Paid | Tax Assessment Tax Assessment Total Assessment is a certain percentage of the fair market value that is determined by local assessors to be the total taxable value of land and additions on the property. | Land | Improvement |
|---|---|---|---|---|
| 2025 | $34,106 | $2,986,398 | $1,787,637 | $1,198,761 |
| 2024 | $34,106 | $2,927,842 | $1,752,586 | $1,175,256 |
| 2023 | $33,772 | $2,870,434 | $1,718,222 | $1,152,212 |
| 2022 | $33,300 | $2,814,152 | $1,684,532 | $1,129,620 |
| 2021 | $32,988 | $2,758,973 | $1,651,502 | $1,107,471 |
| 2020 | $32,613 | $2,730,684 | $1,634,568 | $1,096,116 |
| 2019 | $31,880 | $2,677,142 | $1,602,518 | $1,074,624 |
| 2018 | $31,156 | $2,624,650 | $1,571,097 | $1,053,553 |
| 2017 | $31,558 | $2,612,209 | $1,579,313 | $1,032,896 |
| 2016 | $30,586 | $2,560,991 | $1,548,347 | $1,012,644 |
| 2015 | $30,417 | $2,522,524 | $1,525,090 | $997,434 |
| 2014 | $29,663 | $2,473,112 | $1,495,216 | $977,896 |
Source: Public Records
Map
Nearby Homes
- 15060 Montebello Rd
- 17599 Montebello Rd
- 22551 Ricardo Rd
- 22346 Regnart Rd
- 11052 Canyon Vista Dr
- 10625 Merriman Rd
- 10177 Camberley Ln
- 22475 Mcclellan Rd
- 10170 Firwood Dr
- 22821 Longdown Rd
- 10471 Scenic Blvd
- 22540 Stevens Creek Blvd
- 21697 Rainbow Dr
- 21685 Regnart Rd
- 22208 Quinterno Ct
- 22448 Salem Ave
- 22136 Dean Ct
- 22215 Quinterno Ct
- 10507 Manzanita Ct Unit 3
- 10140 Hillcrest Rd
- 13225 Peacock Ct
- 13220 Peacock Ct
- 6 Swiss Creek Lane 006
- 7 Swiss Creek Lane Lot 007
- 000 Swiss Creek Lane Lot 007
- 0000 Swiss Creek Ln
- 13215 Peacock Ct
- 13205 Peacock Ct
- 13209 Peacock Ct
- Lot 4 Peacock Ct
- Lot 6 Peacock Ct
- 4 Peacock Ct
- 13212 Peacock Ct
- 13208 Peacock Ct
- 13001 Montebello Rd
- 15595 Swiss Creek Ln
- 15545 Swiss Creek Ln
- 13201 Montebello Rd
- null Stevens Canyon Rd
- 0 Swiss Creek (Lot 2 of 2) Ln Unit ML81904710
Your Personal Tour Guide
Ask me questions while you tour the home.