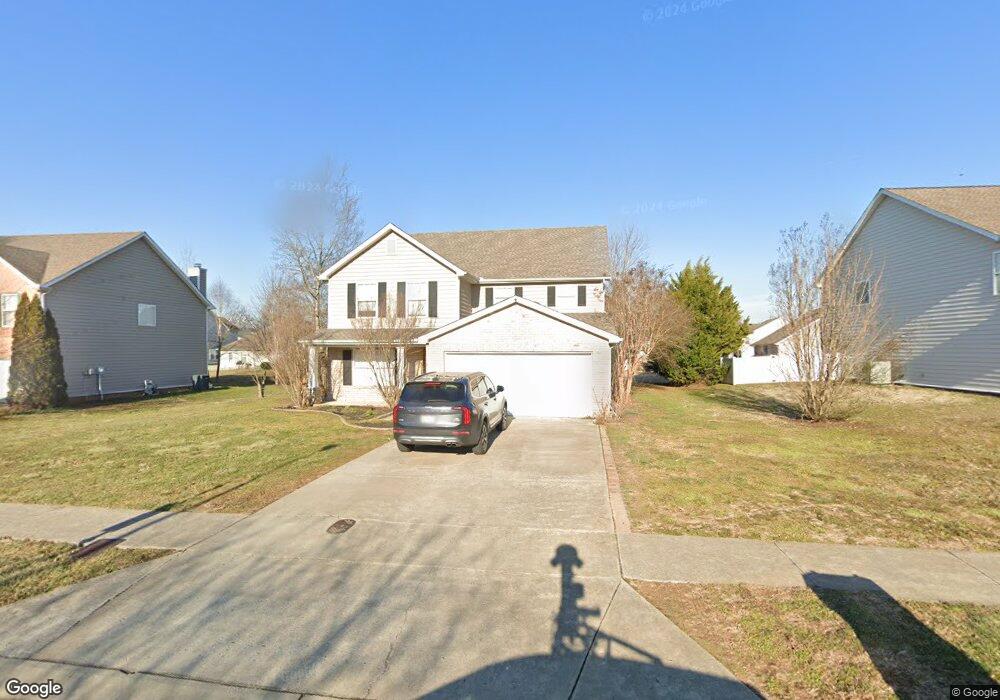
1323 Chopin Ct S Murfreesboro, TN 37128
Estimated Value: $455,000 - $519,000
--
Bed
3
Baths
2,846
Sq Ft
$173/Sq Ft
Est. Value
About This Home
This home is located at 1323 Chopin Ct S, Murfreesboro, TN 37128 and is currently estimated at $492,984, approximately $173 per square foot. 1323 Chopin Ct S is a home located in Rutherford County with nearby schools including Blackman Elementary School, Overall Creek Elementary School, and Blackman Middle School.
Ownership History
Date
Name
Owned For
Owner Type
Purchase Details
Closed on
Sep 21, 2020
Sold by
Philpot Elizabeth M
Bought by
Philpot Elizabeth M and Elizabeth M Philpot Revocable Trust
Current Estimated Value
Purchase Details
Closed on
Aug 13, 2014
Sold by
Stephenson Michael D
Bought by
Philpot Don G Elizabeth M
Purchase Details
Closed on
Jun 20, 2011
Sold by
Nobel Kimberly
Bought by
Stephenson Michael D
Home Financials for this Owner
Home Financials are based on the most recent Mortgage that was taken out on this home.
Original Mortgage
$169,750
Interest Rate
4.63%
Mortgage Type
Commercial
Purchase Details
Closed on
Sep 22, 2003
Sold by
Centex Homes
Bought by
Kimberly Nobel
Home Financials for this Owner
Home Financials are based on the most recent Mortgage that was taken out on this home.
Original Mortgage
$146,245
Interest Rate
6.28%
Purchase Details
Closed on
Mar 4, 2003
Sold by
Parks and Marie
Bought by
Castle Rock Construction
Create a Home Valuation Report for This Property
The Home Valuation Report is an in-depth analysis detailing your home's value as well as a comparison with similar homes in the area
Home Values in the Area
Average Home Value in this Area
Purchase History
| Date | Buyer | Sale Price | Title Company |
|---|---|---|---|
| Philpot Elizabeth M | -- | None Available | |
| Philpot Don G Elizabeth M | $215,000 | -- | |
| Stephenson Michael D | $175,000 | -- | |
| Kimberly Nobel | $164,321 | -- | |
| Castle Rock Construction | $40,380 | -- |
Source: Public Records
Mortgage History
| Date | Status | Borrower | Loan Amount |
|---|---|---|---|
| Previous Owner | Stephenson Michael D | $169,750 | |
| Previous Owner | Castle Rock Construction | $146,245 |
Source: Public Records
Tax History Compared to Growth
Tax History
| Year | Tax Paid | Tax Assessment Tax Assessment Total Assessment is a certain percentage of the fair market value that is determined by local assessors to be the total taxable value of land and additions on the property. | Land | Improvement |
|---|---|---|---|---|
| 2025 | -- | $99,525 | $13,750 | $85,775 |
| 2024 | -- | $99,525 | $13,750 | $85,775 |
| 2023 | $1,867 | $99,525 | $13,750 | $85,775 |
| 2022 | $1,609 | $99,525 | $13,750 | $85,775 |
| 2021 | $1,508 | $67,925 | $10,000 | $57,925 |
| 2020 | $1,508 | $67,925 | $10,000 | $57,925 |
| 2019 | $1,508 | $67,925 | $10,000 | $57,925 |
| 2018 | $2,071 | $67,925 | $0 | $0 |
| 2017 | $1,913 | $49,225 | $0 | $0 |
| 2016 | $1,913 | $49,225 | $0 | $0 |
| 2015 | $1,913 | $49,225 | $0 | $0 |
| 2014 | $1,224 | $49,225 | $0 | $0 |
| 2013 | -- | $49,300 | $0 | $0 |
Source: Public Records
Map
Nearby Homes
- 1526 Dewsbury Dr
- 5408 Middlebury Dr
- 2108 Olmstead Ct
- 5227 Starnes Dr
- 4814 Saint Ives Dr
- 1232 Stockwell Dr
- 1235 Timber Creek Dr
- 1217 Westlawn Blvd
- 4332 Pender Ct
- 5350 Tony Lama Ln
- 4439 Chusto Dr
- 1716 John Lee Ln
- 5309 Perlou Ln
- 6410 Hickory Bell Dr
- 1614 Lannister Ave
- 0 Burnt Knob Rd
- 0 Vaughn Rd
- 1704 Lannister Ave
- 4304 Faran David Ct
- 827 Stovers Glen Dr
- 1319 Chopin Ct S
- 1327 Chopin Ct S
- 5511 Middlebury Dr
- 5515 Middlebury Dr
- 5507 Middlebury Dr
- 1318 Chopin Ct S
- 1314 Chopin Ct S
- 1315 Chopin Ct S
- 1331 Chopin Ct S
- 5519 Middlebury Dr
- 1322 Chopin Ct S
- 5523 Middlebury Dr
- 1335 Chopin Ct S
- 1326 Chopin Ct S
- 1311 Chopin Ct S
- 1330 Chopin Ct S
- 5527 Middlebury Dr
- 5742 Roxbury Dr
- 5738 Roxbury Dr
- 1405 Prescott Ct