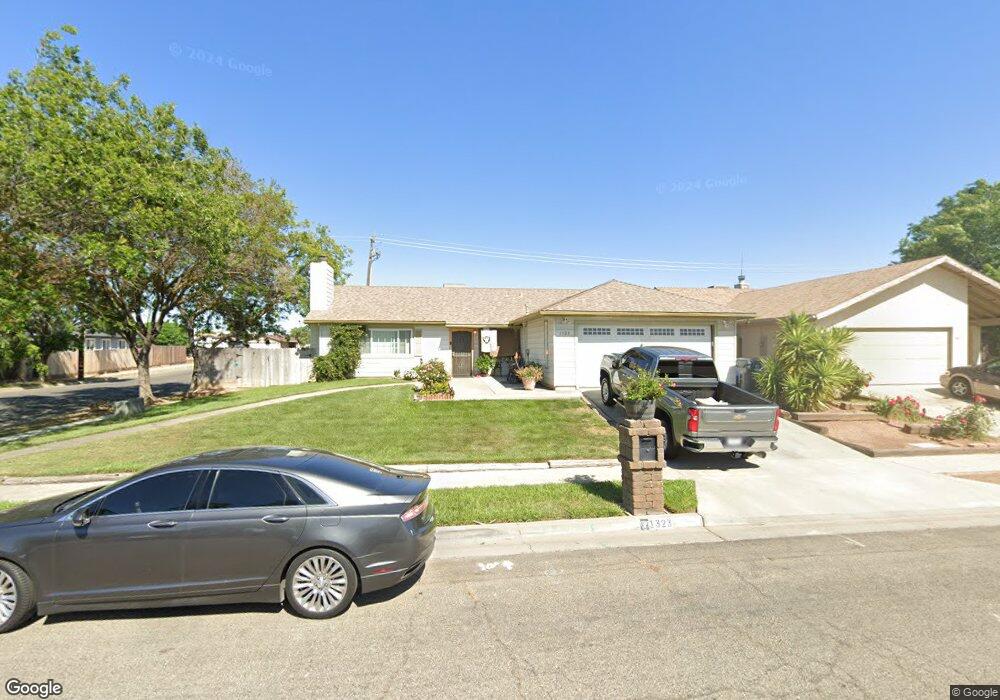
1323 Fountain Way Madera, CA 93638
North Madera NeighborhoodEstimated Value: $279,000 - $364,000
3
Beds
2
Baths
1,411
Sq Ft
$240/Sq Ft
Est. Value
About This Home
This home is located at 1323 Fountain Way, Madera, CA 93638 and is currently estimated at $338,811, approximately $240 per square foot. 1323 Fountain Way is a home located in Madera County with nearby schools including James Monroe Elementary School, Jack G. Desmond Middle School, and Madera South High School.
Ownership History
Date
Name
Owned For
Owner Type
Purchase Details
Closed on
Feb 18, 2020
Sold by
Martinez and William
Bought by
Martinez Danita Jesus and Batt William John
Current Estimated Value
Home Financials for this Owner
Home Financials are based on the most recent Mortgage that was taken out on this home.
Original Mortgage
$185,803
Outstanding Balance
$164,889
Interest Rate
3.72%
Mortgage Type
New Conventional
Estimated Equity
$173,922
Purchase Details
Closed on
Feb 12, 2020
Sold by
Martinez Danita and Batt William
Bought by
Martinez Danita Jesus and Batt William John
Home Financials for this Owner
Home Financials are based on the most recent Mortgage that was taken out on this home.
Original Mortgage
$185,803
Outstanding Balance
$164,889
Interest Rate
3.72%
Mortgage Type
New Conventional
Estimated Equity
$173,922
Purchase Details
Closed on
Dec 19, 2006
Sold by
Batt William and Martinez Danita
Bought by
Batt William and Martinez Danita
Create a Home Valuation Report for This Property
The Home Valuation Report is an in-depth analysis detailing your home's value as well as a comparison with similar homes in the area
Home Values in the Area
Average Home Value in this Area
Purchase History
| Date | Buyer | Sale Price | Title Company |
|---|---|---|---|
| Martinez Danita Jesus | -- | Fidelity National Title | |
| Martinez Danita Jesus | -- | Fidelity National Title Co | |
| Batt William | -- | None Available |
Source: Public Records
Mortgage History
| Date | Status | Borrower | Loan Amount |
|---|---|---|---|
| Open | Martinez Danita Jesus | $185,803 | |
| Closed | Martinez Danita Jesus | $185,803 |
Source: Public Records
Tax History Compared to Growth
Tax History
| Year | Tax Paid | Tax Assessment Tax Assessment Total Assessment is a certain percentage of the fair market value that is determined by local assessors to be the total taxable value of land and additions on the property. | Land | Improvement |
|---|---|---|---|---|
| 2025 | $1,665 | $149,289 | $29,366 | $119,923 |
| 2023 | $1,665 | $143,494 | $28,227 | $115,267 |
| 2022 | $1,554 | $140,681 | $27,674 | $113,007 |
| 2021 | $1,524 | $137,924 | $27,132 | $110,792 |
| 2020 | $1,550 | $136,510 | $26,854 | $109,656 |
| 2019 | $1,538 | $133,834 | $26,328 | $107,506 |
| 2018 | $1,272 | $118,215 | $30,749 | $87,466 |
| 2017 | $1,219 | $112,586 | $29,285 | $83,301 |
| 2016 | $1,187 | $110,379 | $28,711 | $81,668 |
| 2015 | $1,115 | $105,123 | $27,344 | $77,779 |
| 2014 | $968 | $96,443 | $25,086 | $71,357 |
Source: Public Records
Map
Nearby Homes
- 1331 Alicante Way
- 27592 Avenue 16
- 27594 Avenue 16
- 1218 E Cleveland Ave Unit 131
- 1218 E Cleveland Ave Unit 4
- 1218 E Cleveland Ave Unit 126
- 1218 E Cleveland Ave Unit 142
- 1218 E Cleveland Ave Unit 114
- 1218 E Cleveland Ave Unit 12
- 1218 E Cleveland Ave Unit 96
- 1218 E Cleveland Ave Unit 123
- 1218 E Cleveland Ave Unit 161
- 1218 E Cleveland Ave Unit 19
- 1218 E Cleveland Ave Unit 86
- 1218 E Cleveland Ave Unit 23
- 1218 E Cleveland Ave Unit 103
- 1218 E Cleveland Ave Unit 153
- 1218 E Cleveland Ave Unit 1
- 1592 Lacreta Ave
- 1206 Merced St
- 1372 Barcelona Way
- 1388 Barcelona Way
- 1354 Barcelona Way
- 1315 Fountain Way
- 1401 Fountain Way
- 1508 Wessmith Way
- 1334 Barcelona Way
- 1416 Barcelona Way
- 1509 Sherwood Way
- 1311 Fountain Way
- 1405 Fountain Way
- 1504 Wessmith Way
- 1326 Barcelona Way
- 1430 Barcelona Way
- 1505 Sherwood Way
- 1375 Barcelona Way
- 1391 Barcelona Way
- 1359 Barcelona Way
- 1500 Wessmith Way
- 1509 Wessmith Way