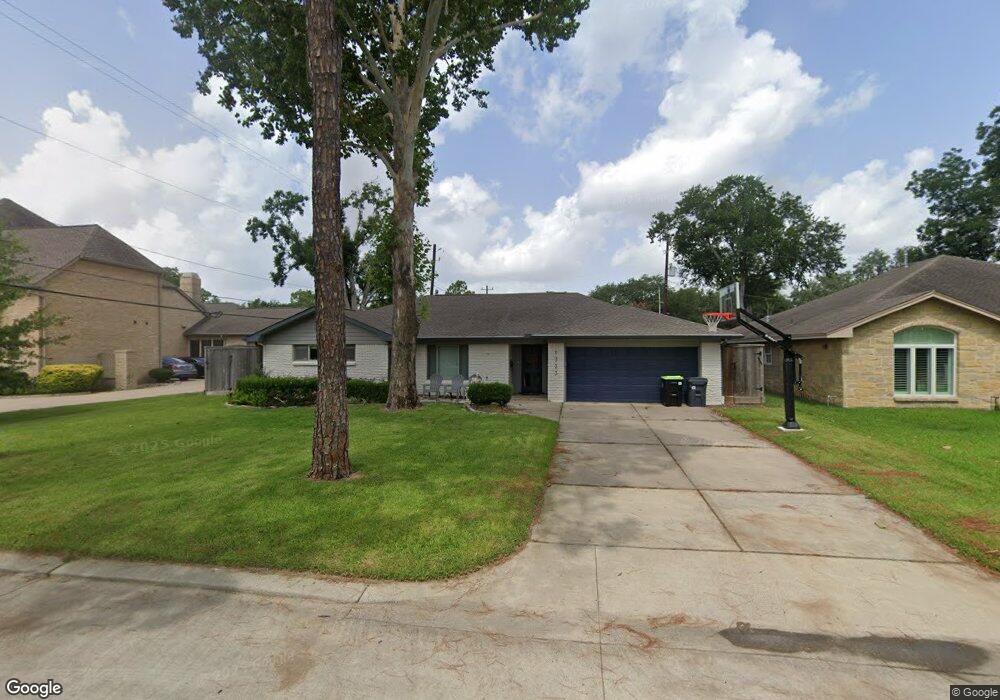
1323 Neeley Dr Houston, TX 77055
Spring Valley NeighborhoodEstimated Value: $921,000 - $1,180,654
4
Beds
3
Baths
2,522
Sq Ft
$427/Sq Ft
Est. Value
About This Home
This home is located at 1323 Neeley Dr, Houston, TX 77055 and is currently estimated at $1,077,414, approximately $427 per square foot. 1323 Neeley Dr is a home located in Harris County with nearby schools including Valley Oaks Elementary School, Spring Branch Middle School, and Memorial High School.
Ownership History
Date
Name
Owned For
Owner Type
Purchase Details
Closed on
May 31, 2016
Sold by
Williams Julia Stromatt
Bought by
Deskin Wesley and Deskin Louiza
Current Estimated Value
Home Financials for this Owner
Home Financials are based on the most recent Mortgage that was taken out on this home.
Original Mortgage
$71,000
Outstanding Balance
$31,823
Interest Rate
3.61%
Mortgage Type
Commercial
Estimated Equity
$1,045,591
Purchase Details
Closed on
Apr 23, 2004
Sold by
Williams Thomas B
Bought by
Williams Julia Stromatt
Home Financials for this Owner
Home Financials are based on the most recent Mortgage that was taken out on this home.
Original Mortgage
$201,500
Interest Rate
5.38%
Mortgage Type
Stand Alone First
Purchase Details
Closed on
Apr 30, 1996
Sold by
Reid Craig A and Reid Christian L
Bought by
Williams Thomas B and Williams Julia Stromatt
Home Financials for this Owner
Home Financials are based on the most recent Mortgage that was taken out on this home.
Original Mortgage
$134,400
Interest Rate
7.8%
Create a Home Valuation Report for This Property
The Home Valuation Report is an in-depth analysis detailing your home's value as well as a comparison with similar homes in the area
Home Values in the Area
Average Home Value in this Area
Purchase History
| Date | Buyer | Sale Price | Title Company |
|---|---|---|---|
| Deskin Wesley | -- | First American Title | |
| Williams Julia Stromatt | $201,500 | Charter Title Co Fort Bend | |
| Williams Thomas B | -- | Stewart Title Company |
Source: Public Records
Mortgage History
| Date | Status | Borrower | Loan Amount |
|---|---|---|---|
| Open | Deskin Wesley | $71,000 | |
| Open | Deskin Wesley | $417,000 | |
| Previous Owner | Williams Julia Stromatt | $201,500 | |
| Previous Owner | Williams Thomas B | $134,400 |
Source: Public Records
Tax History Compared to Growth
Tax History
| Year | Tax Paid | Tax Assessment Tax Assessment Total Assessment is a certain percentage of the fair market value that is determined by local assessors to be the total taxable value of land and additions on the property. | Land | Improvement |
|---|---|---|---|---|
| 2025 | $14,399 | $1,091,414 | $649,350 | $442,064 |
| 2024 | $14,399 | $930,000 | $619,380 | $310,620 |
| 2023 | $14,399 | $924,329 | $579,420 | $344,909 |
| 2022 | $18,889 | $855,000 | $549,450 | $305,550 |
| 2021 | $17,454 | $793,118 | $524,475 | $268,643 |
| 2020 | $16,260 | $688,199 | $524,475 | $163,724 |
| 2019 | $14,412 | $585,950 | $524,475 | $61,475 |
| 2018 | $2,947 | $580,000 | $524,475 | $55,525 |
| 2017 | $15,025 | $610,000 | $524,475 | $85,525 |
| 2016 | $12,778 | $612,985 | $524,475 | $88,510 |
| 2015 | $8,428 | $612,985 | $524,475 | $88,510 |
| 2014 | $8,428 | $494,682 | $409,590 | $85,092 |
Source: Public Records
Map
Nearby Homes
- 1328 Bingle Rd
- 1324 Bingle Rd
- 8606 Westview Dr
- 8521 Merlin Dr
- 8610 Cedarbrake Dr
- 8619 Cedarbrake Dr
- 1441 Bingle Rd
- 1314 Caudle Dr
- 8830 Merlin Dr
- 1506 Longacre Dr
- 1526 Ojeman Rd Unit A
- 1510 Longacre Dr
- 2 Burkhart Forest Ct
- 1614 Ojeman Rd Unit E
- 1614 Ojeman Rd Unit J
- 8837 Larston St
- 8706 Strongoak Ln
- 1607 W Rose Terrace Ln
- 1653 Bingle Rd
- 1701 Bayram Dr
- 1327 Neeley Dr
- 1319 Neeley Dr
- 1331 Neeley Dr
- 1320 Bingle Rd
- 1324 Neeley Dr
- 1328 Neeley Dr
- 1332 Bingle Dr
- 1332 Bingle Rd
- 1322 Neeley Dr
- 1318 Bingle Rd
- 1335 Neeley Dr
- 1332 Neeley Dr
- 1320 Neeley Dr
- 1315 Neeley Dr
- 8526 Merlin Dr
- 8521 Westview Dr
- 1336 Neeley Dr
- 1316 Neeley Dr
- 8530 Merlin Dr
- 8602 Lupton Ln