1323 W 7th St Davenport, IA 52802
Riverview Terrace NeighborhoodEstimated Value: $84,000 - $136,000
5
Beds
3
Baths
2,245
Sq Ft
$49/Sq Ft
Est. Value
About This Home
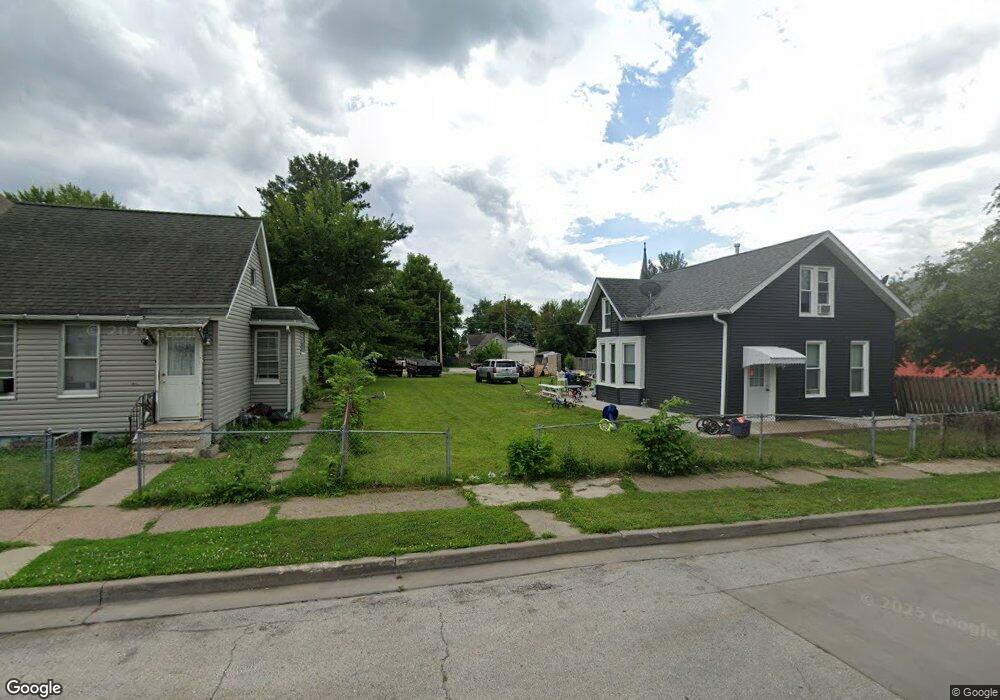
This home is located at 1323 W 7th St, Davenport, IA 52802 and is currently estimated at $109,925, approximately $48 per square foot. 1323 W 7th St is a home located in Scott County with nearby schools including Walnut Hill Elementary School, South Christian Elementary School, and Christian County Middle School.
Ownership History
Date
Name
Owned For
Owner Type
Purchase Details
Closed on
Oct 10, 2024
Sold by
Scott County Iowa
Bought by
Palma Rolando and Palma Beatriz
Current Estimated Value
Purchase Details
Closed on
Oct 11, 2023
Sold by
Treasurer Of Scott County
Bought by
Residential Equity Partners Llc
Purchase Details
Closed on
Sep 9, 2015
Sold by
Nervig James
Bought by
Residential Equity Partners Llc
Create a Home Valuation Report for This Property
The Home Valuation Report is an in-depth analysis detailing your home's value as well as a comparison with similar homes in the area
Home Values in the Area
Average Home Value in this Area
Purchase History
| Date | Buyer | Sale Price | Title Company |
|---|---|---|---|
| Palma Rolando | $2,500 | None Listed On Document | |
| Residential Equity Partners Llc | $4,199 | None Listed On Document | |
| Residential Equity Partners Llc | $841 | None Available |
Source: Public Records
Tax History Compared to Growth
Tax History
| Year | Tax Paid | Tax Assessment Tax Assessment Total Assessment is a certain percentage of the fair market value that is determined by local assessors to be the total taxable value of land and additions on the property. | Land | Improvement |
|---|---|---|---|---|
| 2025 | -- | $2,570 | $2,570 | $0 |
| 2024 | $2,550 | $2,570 | $0 | $0 |
| 2023 | $2,630 | $2,570 | $2,570 | $0 |
| 2022 | $2,509 | $1,830 | $1,830 | $0 |
| 2021 | $40 | $1,830 | $1,830 | $0 |
| 2020 | $3,260 | $1,830 | $1,830 | $0 |
| 2019 | $3,555 | $1,830 | $1,830 | $0 |
| 2018 | $3,716 | $1,830 | $1,830 | $0 |
| 2017 | $838 | $1,830 | $1,830 | $0 |
| 2016 | $1,477 | $18,640 | $0 | $0 |
| 2015 | $423 | $23,220 | $0 | $0 |
| 2014 | $516 | $23,220 | $0 | $0 |
| 2013 | $506 | $0 | $0 | $0 |
| 2012 | -- | $34,140 | $4,920 | $29,220 |
Source: Public Records
Map
Nearby Homes