Estimated Value: $601,455 - $800,000
2
Beds
3
Baths
1,179
Sq Ft
$582/Sq Ft
Est. Value
About This Home
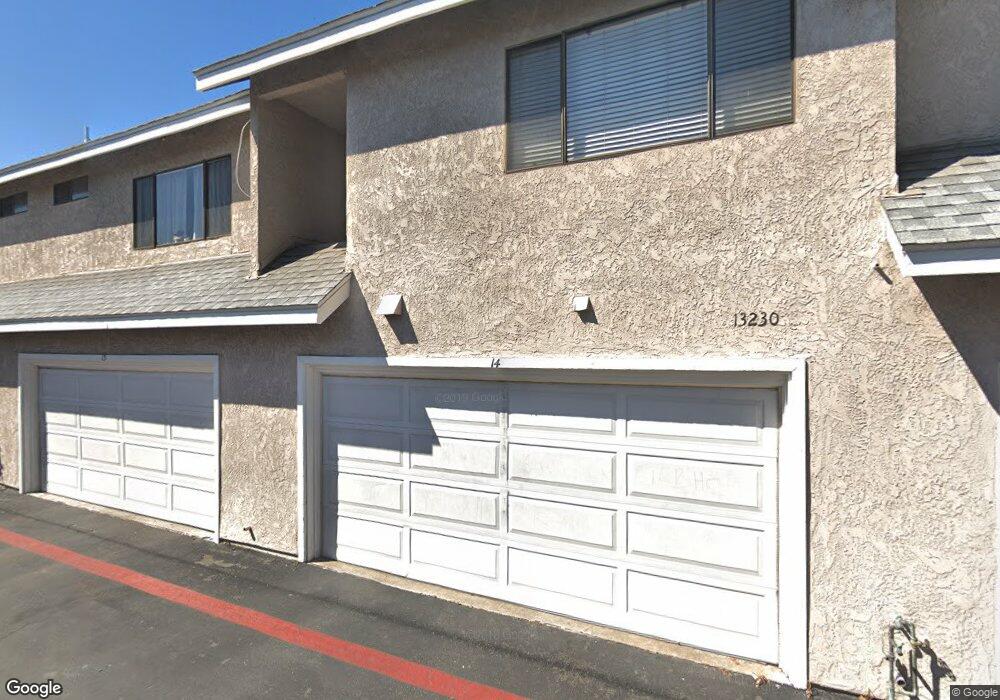
This home is located at 13230 Johannesberg Way Unit 19, Poway, CA 92064 and is currently estimated at $685,864, approximately $581 per square foot. 13230 Johannesberg Way Unit 19 is a home located in San Diego County with nearby schools including Garden Road Elementary, Twin Peaks Middle, and Poway High.
Ownership History
Date
Name
Owned For
Owner Type
Purchase Details
Closed on
Aug 6, 2025
Sold by
Prentiss Kristine K
Bought by
Kristine K Prentiss Trust and Prentiss
Current Estimated Value
Purchase Details
Closed on
Aug 29, 2000
Sold by
Peterson Family Trust 05-13-97 and Allen Jerry Allen
Bought by
Prentiss Kristine K
Home Financials for this Owner
Home Financials are based on the most recent Mortgage that was taken out on this home.
Original Mortgage
$132,800
Interest Rate
7.98%
Mortgage Type
Purchase Money Mortgage
Purchase Details
Closed on
May 13, 1997
Sold by
Peterson Jerry A and Peterson Sabina T
Bought by
Peterson Jerry Allen and Peterson Sabina Theresia
Purchase Details
Closed on
Feb 28, 1996
Sold by
Peterson Sabina
Bought by
Peterson Jerry A
Purchase Details
Closed on
Jun 1, 1984
Create a Home Valuation Report for This Property
The Home Valuation Report is an in-depth analysis detailing your home's value as well as a comparison with similar homes in the area
Home Values in the Area
Average Home Value in this Area
Purchase History
| Date | Buyer | Sale Price | Title Company |
|---|---|---|---|
| Kristine K Prentiss Trust | -- | None Listed On Document | |
| Prentiss Kristine K | $166,000 | First American Title Ins Co | |
| Peterson Jerry Allen | -- | -- | |
| Peterson Jerry A | -- | Fidelity National Title | |
| -- | $87,000 | -- |
Source: Public Records
Mortgage History
| Date | Status | Borrower | Loan Amount |
|---|---|---|---|
| Previous Owner | Prentiss Kristine K | $132,800 |
Source: Public Records
Tax History Compared to Growth
Tax History
| Year | Tax Paid | Tax Assessment Tax Assessment Total Assessment is a certain percentage of the fair market value that is determined by local assessors to be the total taxable value of land and additions on the property. | Land | Improvement |
|---|---|---|---|---|
| 2025 | $2,767 | $250,111 | $116,015 | $134,096 |
| 2024 | $2,767 | $245,208 | $113,741 | $131,467 |
| 2023 | $2,708 | $240,401 | $111,511 | $128,890 |
| 2022 | $2,662 | $235,688 | $109,325 | $126,363 |
| 2021 | $2,627 | $231,068 | $107,182 | $123,886 |
| 2020 | $2,592 | $228,699 | $106,083 | $122,616 |
| 2019 | $2,525 | $224,215 | $104,003 | $120,212 |
| 2018 | $2,455 | $219,819 | $101,964 | $117,855 |
| 2017 | $172 | $215,510 | $99,965 | $115,545 |
| 2016 | $2,340 | $211,285 | $98,005 | $113,280 |
| 2015 | $2,305 | $208,112 | $96,533 | $111,579 |
| 2014 | $2,252 | $204,037 | $94,643 | $109,394 |
Source: Public Records
Map
Nearby Homes
- 13230 Johannesberg Way Unit 10
- 13255 Evanston Dr
- 13648 Putney Rd
- 13409 Sutter Mill Rd
- 13654 Somerset Rd
- 13918 Putney Rd
- 13403 Little Dawn Ln
- 13329 Casa Vista St Unit 98
- 14287 Lolin Ln
- 13544 Comuna Dr
- 13286 Creek Park Ln
- 14082 Pomegranate Ave Unit 146
- 13325 Alpine Dr Unit 11
- 14514 Kennebunk St
- 14513 Mirando St
- 13056 Poway Rd
- 13114 Dana Vista St Unit 345
- 1/2 Poway Rd
- 13104 Corona Way Unit 324
- 14543 Kittery St
- 13230 Johannesberg Way
- 13230 Johannesberg Way Unit 15
- 13230 Johannesberg Way Unit 13
- 13230 Johannesberg Way Unit 18
- 13230 Johannesberg Way Unit 17
- 13230 Johannesberg Way Unit 16
- 13230 Johannesberg Way Unit 14
- 13230 Johannesberg Way Unit 12
- 13230 Johannesberg Way Unit 11
- 13230 Johannesberg Way Unit 9
- 13815 Johannesberg Dr
- 13815 Johannesberg Dr Unit 3
- 13815 Johannesberg Dr Unit 2
- 13815 Johannesberg Dr Unit 1
- 13815 Johannesberg Dr Unit 8
- 13815 Johannesberg Dr Unit 7
- 13815 Johannesberg Dr Unit 6
- 13815 Johannesberg Dr Unit 5
- 13815 Johannesberg Dr Unit 4
- 13221 Westmark Way