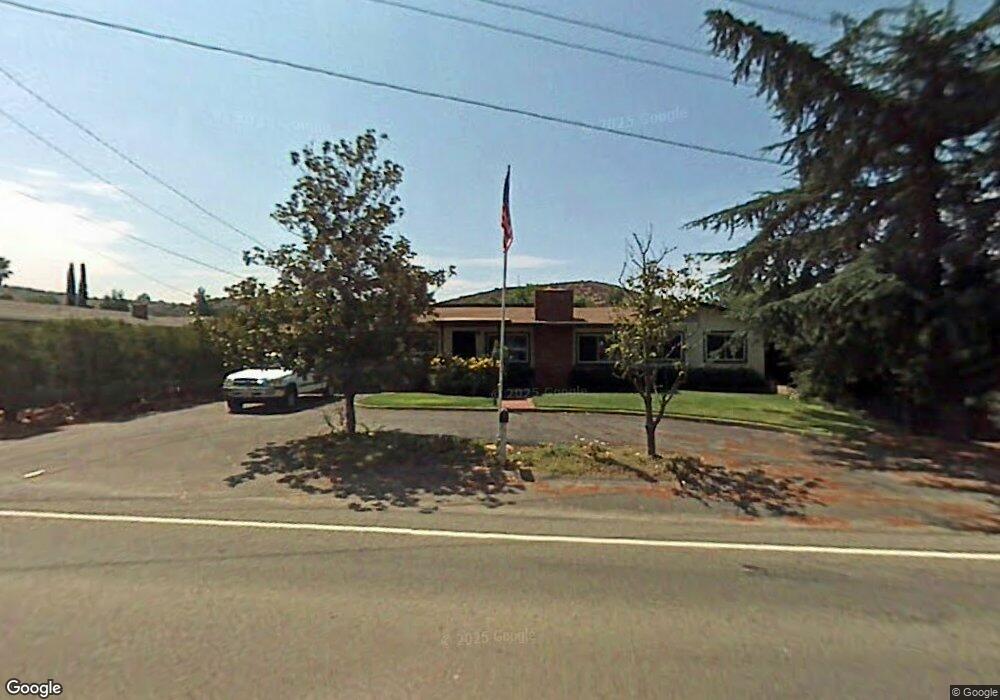
13239 Julian Ave Lakeside, CA 92040
Lakeview NeighborhoodEstimated Value: $787,000 - $938,000
3
Beds
2
Baths
1,398
Sq Ft
$598/Sq Ft
Est. Value
About This Home
This home is located at 13239 Julian Ave, Lakeside, CA 92040 and is currently estimated at $835,801, approximately $597 per square foot. 13239 Julian Ave is a home located in San Diego County with nearby schools including Lakeview Elementary School, Tierra Del Sol Middle School, and El Capitan High School.
Ownership History
Date
Name
Owned For
Owner Type
Purchase Details
Closed on
Sep 4, 2021
Sold by
Bayer Dennis C
Bought by
Bayer Dennis C and Ray Debra L
Current Estimated Value
Purchase Details
Closed on
May 24, 2006
Sold by
Sniffen Marilyn L
Bought by
Sniffen Arden
Home Financials for this Owner
Home Financials are based on the most recent Mortgage that was taken out on this home.
Original Mortgage
$213,500
Outstanding Balance
$124,497
Interest Rate
6.52%
Mortgage Type
Fannie Mae Freddie Mac
Estimated Equity
$711,304
Purchase Details
Closed on
May 3, 2006
Sold by
Jeffries John V
Bought by
Bayer Dennis and Sniffen Arden
Home Financials for this Owner
Home Financials are based on the most recent Mortgage that was taken out on this home.
Original Mortgage
$213,500
Outstanding Balance
$124,497
Interest Rate
6.52%
Mortgage Type
Fannie Mae Freddie Mac
Estimated Equity
$711,304
Create a Home Valuation Report for This Property
The Home Valuation Report is an in-depth analysis detailing your home's value as well as a comparison with similar homes in the area
Home Values in the Area
Average Home Value in this Area
Purchase History
| Date | Buyer | Sale Price | Title Company |
|---|---|---|---|
| Bayer Dennis C | -- | None Available | |
| Sniffen Arden | -- | First American Title Co | |
| Bayer Dennis | $435,000 | First American Title Co |
Source: Public Records
Mortgage History
| Date | Status | Borrower | Loan Amount |
|---|---|---|---|
| Open | Bayer Dennis | $213,500 |
Source: Public Records
Tax History Compared to Growth
Tax History
| Year | Tax Paid | Tax Assessment Tax Assessment Total Assessment is a certain percentage of the fair market value that is determined by local assessors to be the total taxable value of land and additions on the property. | Land | Improvement |
|---|---|---|---|---|
| 2025 | $7,608 | $594,416 | $286,960 | $307,456 |
| 2024 | $7,608 | $582,762 | $281,334 | $301,428 |
| 2023 | $7,327 | $571,336 | $275,818 | $295,518 |
| 2022 | $7,193 | $560,134 | $270,410 | $289,724 |
| 2021 | $7,095 | $549,152 | $265,108 | $284,044 |
| 2020 | $6,403 | $495,000 | $235,000 | $260,000 |
| 2019 | $6,160 | $475,000 | $226,000 | $249,000 |
| 2018 | $5,974 | $460,000 | $219,000 | $241,000 |
| 2017 | $820 | $410,000 | $196,000 | $214,000 |
| 2016 | $4,805 | $370,000 | $177,000 | $193,000 |
| 2015 | $4,600 | $350,000 | $168,000 | $182,000 |
| 2014 | $4,232 | $330,000 | $159,000 | $171,000 |
Source: Public Records
Map
Nearby Homes
- 13138 Julian Ave
- 9731 Lakeview Rd
- 13481 Khuram St
- 9616 Petite Ln
- 10020 Pino Dr
- 13655 Lenteja Ln
- 13049 Chrissy Way
- 9518 Cypress St
- 9903 Lindo Lake Place
- 10025 Tamil Rd
- 10032 Tamil Rd
- 12741 Laurel St
- 12709 Castle Court Dr
- 12923 Mapleview St Unit 6
- 12923 Mapleview St Unit 8
- 12643 Castle Court Dr
- 12650 Lakeshore Dr Unit 115
- 13259 Saddle Ridge Rd
- 12710 Laurel St Unit 113
- 12740 Casa Vista Rd
- 9677 Christmas Tree Ln
- 13235 Julian Ave
- 13315 Julian Ave
- 9649 Christmas Tree Ln
- 13240 Julian Ave
- 13248 Julian Ave
- 13308 Julian Ave
- 13226 Julian Ave
- 13323 Julian Ave
- 9639 Christmas Tree Ln
- 13310 Julian Ave
- 9652 Lakeview Rd
- 13216 Julian Ave
- 13335 Julian Ave
- 9646 Lakeview Rd
- 13208 Julian Ave
- 9649 Pino Dr
- 13237 Lindo Ln
- 13245 Lindo Ln
- 13229 Lindo Ln