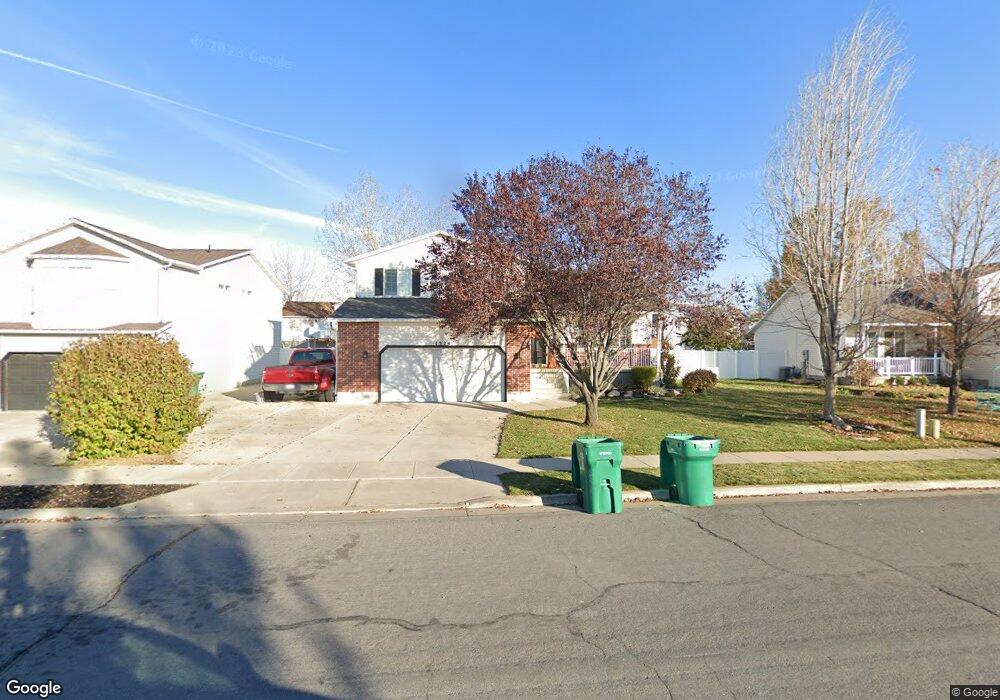
1324 N 2575 W Layton, UT 84041
Estimated Value: $530,000 - $577,000
5
Beds
4
Baths
3,040
Sq Ft
$181/Sq Ft
Est. Value
About This Home
This home is located at 1324 N 2575 W, Layton, UT 84041 and is currently estimated at $551,666, approximately $181 per square foot. 1324 N 2575 W is a home located in Davis County with nearby schools including Ellison Park School, Shoreline Junior High School, and Layton High School.
Ownership History
Date
Name
Owned For
Owner Type
Purchase Details
Closed on
Jul 3, 2017
Sold by
Peterson Brett R and Peterson Dana L
Bought by
Seamons Devin and Seamons Deana K
Current Estimated Value
Home Financials for this Owner
Home Financials are based on the most recent Mortgage that was taken out on this home.
Original Mortgage
$289,656
Outstanding Balance
$242,435
Interest Rate
4.25%
Mortgage Type
FHA
Estimated Equity
$309,231
Purchase Details
Closed on
Mar 6, 2003
Sold by
Markland Brian D and Markland Heidi R
Bought by
Peterson Brett R and Peterson Dana L
Home Financials for this Owner
Home Financials are based on the most recent Mortgage that was taken out on this home.
Original Mortgage
$130,400
Interest Rate
5.85%
Purchase Details
Closed on
Feb 8, 1999
Sold by
Woodside Homes Corp
Bought by
Markland Brian D and Markland Heidi R
Home Financials for this Owner
Home Financials are based on the most recent Mortgage that was taken out on this home.
Original Mortgage
$106,000
Interest Rate
6.79%
Create a Home Valuation Report for This Property
The Home Valuation Report is an in-depth analysis detailing your home's value as well as a comparison with similar homes in the area
Home Values in the Area
Average Home Value in this Area
Purchase History
| Date | Buyer | Sale Price | Title Company |
|---|---|---|---|
| Seamons Devin | -- | Us Title | |
| Peterson Brett R | -- | Equity Title Agency | |
| Markland Brian D | -- | First American Title Co |
Source: Public Records
Mortgage History
| Date | Status | Borrower | Loan Amount |
|---|---|---|---|
| Open | Seamons Devin | $289,656 | |
| Previous Owner | Peterson Brett R | $130,400 | |
| Previous Owner | Markland Brian D | $106,000 |
Source: Public Records
Tax History
| Year | Tax Paid | Tax Assessment Tax Assessment Total Assessment is a certain percentage of the fair market value that is determined by local assessors to be the total taxable value of land and additions on the property. | Land | Improvement |
|---|---|---|---|---|
| 2025 | $2,730 | $286,550 | $108,938 | $177,612 |
| 2024 | $2,637 | $278,850 | $120,912 | $157,938 |
| 2023 | $2,527 | $471,000 | $118,831 | $352,169 |
| 2022 | $2,750 | $278,300 | $74,862 | $203,438 |
| 2021 | $2,411 | $364,000 | $112,323 | $251,677 |
| 2020 | $2,175 | $315,000 | $94,322 | $220,678 |
| 2019 | $2,108 | $299,000 | $97,366 | $201,634 |
| 2018 | $2,030 | $289,000 | $85,331 | $203,669 |
| 2016 | $1,647 | $121,001 | $33,226 | $87,775 |
| 2015 | $1,652 | $115,226 | $33,226 | $82,000 |
| 2014 | $1,551 | $110,569 | $33,226 | $77,343 |
| 2013 | -- | $113,368 | $28,952 | $84,416 |
Source: Public Records
Map
Nearby Homes
- 1186 N 2425 W
- 1250 N 2925 W
- 1141 N 2275 W
- 1969 S 575 E
- 195 E 2325 S
- 2144 W 1275 N
- 1877 S 725 E
- 1876 W 1575 N Unit 237
- 816 N 2700 W
- 1570 N 1875 W Unit 242
- 1570 N 1875 W
- 1558 N 1875 W
- 1558 N 1875 W Unit 245
- 906 E Sam Cir
- 1491 N 1875 W
- 1487 N 1875 W
- 1487 N 1875 W Unit 159
- 1483 N 1875 W
- 1479 N 1875 W
- 1479 N 1875 W Unit 161
Your Personal Tour Guide
Ask me questions while you tour the home.