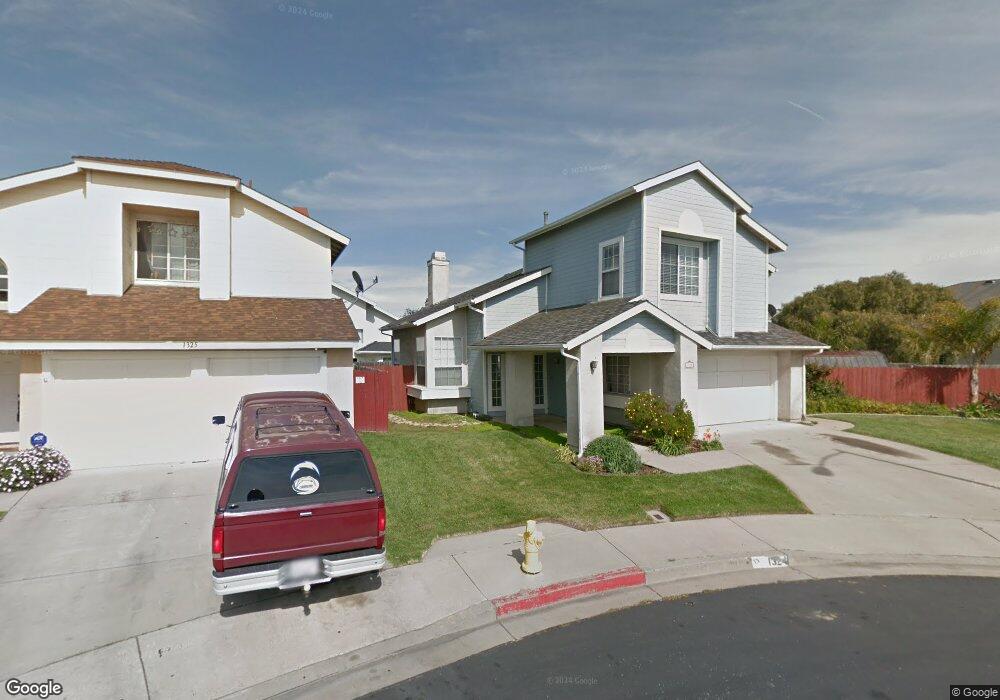
1324 Sherry Place Lompoc, CA 93436
Estimated Value: $568,370 - $595,000
3
Beds
3
Baths
1,482
Sq Ft
$392/Sq Ft
Est. Value
About This Home
This home is located at 1324 Sherry Place, Lompoc, CA 93436 and is currently estimated at $580,843, approximately $391 per square foot. 1324 Sherry Place is a home located in Santa Barbara County with nearby schools including La Canada Elementary School, Lompoc Valley Middle School, and Lompoc High School.
Ownership History
Date
Name
Owned For
Owner Type
Purchase Details
Closed on
Nov 6, 2024
Sold by
Johnston Owen Michael
Bought by
Johnston Family Trust and Johnston
Current Estimated Value
Purchase Details
Closed on
Nov 23, 2016
Sold by
Sierra Paul F
Bought by
Johnston Owen M
Home Financials for this Owner
Home Financials are based on the most recent Mortgage that was taken out on this home.
Original Mortgage
$328,906
Interest Rate
3.25%
Mortgage Type
FHA
Purchase Details
Closed on
Jun 9, 2016
Sold by
Cox Laurie Jean
Bought by
Sierra Paul F
Home Financials for this Owner
Home Financials are based on the most recent Mortgage that was taken out on this home.
Original Mortgage
$191,000
Interest Rate
3.6%
Mortgage Type
New Conventional
Create a Home Valuation Report for This Property
The Home Valuation Report is an in-depth analysis detailing your home's value as well as a comparison with similar homes in the area
Home Values in the Area
Average Home Value in this Area
Purchase History
| Date | Buyer | Sale Price | Title Company |
|---|---|---|---|
| Johnston Family Trust | -- | None Listed On Document | |
| Johnston Owen M | $335,000 | First American Title Company | |
| Sierra Paul F | -- | Chicago Title Company | |
| Sierra Paul F | -- | Chicago Title Company |
Source: Public Records
Mortgage History
| Date | Status | Borrower | Loan Amount |
|---|---|---|---|
| Previous Owner | Johnston Owen M | $328,906 | |
| Previous Owner | Sierra Paul F | $191,000 |
Source: Public Records
Tax History
| Year | Tax Paid | Tax Assessment Tax Assessment Total Assessment is a certain percentage of the fair market value that is determined by local assessors to be the total taxable value of land and additions on the property. | Land | Improvement |
|---|---|---|---|---|
| 2025 | $4,242 | $388,792 | $98,647 | $290,145 |
| 2023 | $4,242 | $373,696 | $94,817 | $278,879 |
| 2022 | $4,169 | $366,369 | $92,958 | $273,411 |
| 2021 | $4,216 | $359,186 | $91,136 | $268,050 |
| 2020 | $4,171 | $355,504 | $90,202 | $265,302 |
| 2019 | $4,102 | $348,534 | $88,434 | $260,100 |
| 2018 | $4,039 | $341,700 | $86,700 | $255,000 |
| 2017 | $3,966 | $335,000 | $85,000 | $250,000 |
| 2016 | $2,740 | $230,020 | $85,477 | $144,543 |
| 2014 | $2,682 | $222,129 | $82,545 | $139,584 |
Source: Public Records
Map
Nearby Homes
- 1012 W Anthony Way
- 901 Alden Ave
- 2020 Green Ridge Cir
- 1103 Point Sal Loop
- 321 W North Ave Unit 133
- 516 N U St
- 1407 N H St
- 531 N O St
- 1355 Crown Cir
- 1445 Crown Cir
- 100 California 1
- 420 N W St
- 526 N L St
- 510 N I St
- 1011 W Walnut Ave
- 267 Village Circle Dr
- 533 N G St
- 1408 W Walnut Ave
- 217 N M St
- 23 Village Circle Dr
- 1328 Sherry Place
- 1205 Jason Dr
- 1125 Lawrence Ln
- 1135 Lawrence Ln Unit 2
- 1329 Sherry Place
- 1332 Sherry Place
- 1333 Sherry Place
- 1124 Lawrence Ln
- 1213 Jason Dr
- 1336 Sherry Place
- 1224 Marigold Way
- 1220 Marigold Way
- 1128 Lawrence Ln Unit 2
- 1204 Jason Dr
- 1421 Village Meadows Dr
- 1429 Village Meadows Dr
- 1433 Village Meadows Dr
Your Personal Tour Guide
Ask me questions while you tour the home.