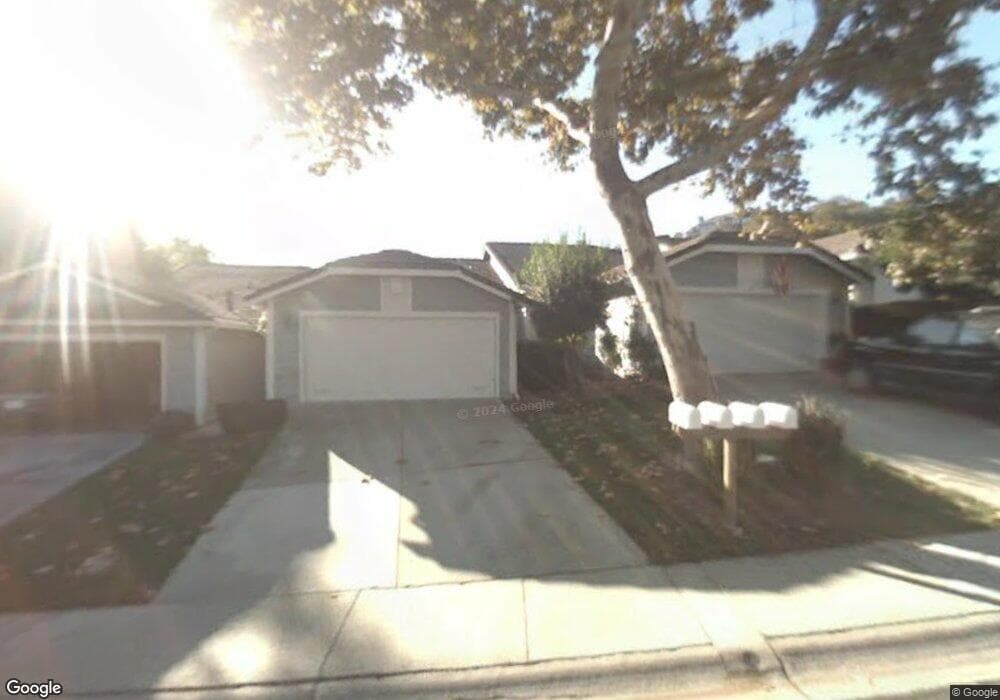
1324 Tiffany Canyon Ct San Jose, CA 95120
--
Bed
--
Bath
--
Sq Ft
2.34
Acres
About This Home
This home is located at 1324 Tiffany Canyon Ct, San Jose, CA 95120. 1324 Tiffany Canyon Ct is a home located in Santa Clara County with nearby schools including Williams Elementary School, Bret Harte Middle School, and Leland High School.
Ownership History
Date
Name
Owned For
Owner Type
Purchase Details
Closed on
Feb 24, 2012
Sold by
Fong Dennis B K and Kam Polly O L
Bought by
Fong Dennis and Kam Polly
Purchase Details
Closed on
Sep 23, 2010
Sold by
Do Diane H and Nguyen Tu H
Bought by
Fong Dennis B K and Kam Polly O L
Purchase Details
Closed on
Apr 22, 2005
Sold by
Bui Thinh T
Bought by
Do Diane
Home Financials for this Owner
Home Financials are based on the most recent Mortgage that was taken out on this home.
Original Mortgage
$588,750
Interest Rate
5.99%
Mortgage Type
Purchase Money Mortgage
Purchase Details
Closed on
Nov 25, 2002
Sold by
Ma Ayling Lee and Ma Cheng Quinn
Bought by
Ma Cheng Quinn and Ma Ayling L
Purchase Details
Closed on
Jun 4, 1998
Sold by
Davidson Charles W and Davidson Anita
Bought by
Ma Cheng Quinn and Ma Ayling Lee
Home Financials for this Owner
Home Financials are based on the most recent Mortgage that was taken out on this home.
Original Mortgage
$311,250
Interest Rate
7.17%
Mortgage Type
Seller Take Back
Create a Home Valuation Report for This Property
The Home Valuation Report is an in-depth analysis detailing your home's value as well as a comparison with similar homes in the area
Home Values in the Area
Average Home Value in this Area
Purchase History
| Date | Buyer | Sale Price | Title Company |
|---|---|---|---|
| Fong Dennis | -- | None Available | |
| Fong Dennis B K | $388,000 | Chicago Title Company | |
| Do Diane | -- | Alliance Title Company | |
| Nguyen Tu H | $785,000 | Alliance Title Company | |
| Ma Cheng Quinn | -- | -- | |
| Ma Cheng Quinn | $415,000 | First American Title Co |
Source: Public Records
Mortgage History
| Date | Status | Borrower | Loan Amount |
|---|---|---|---|
| Previous Owner | Nguyen Tu H | $588,750 | |
| Previous Owner | Ma Cheng Quinn | $311,250 |
Source: Public Records
Tax History Compared to Growth
Tax History
| Year | Tax Paid | Tax Assessment Tax Assessment Total Assessment is a certain percentage of the fair market value that is determined by local assessors to be the total taxable value of land and additions on the property. | Land | Improvement |
|---|---|---|---|---|
| 2025 | $6,419 | $497,090 | $497,090 | -- |
| 2024 | $6,419 | $487,344 | $487,344 | -- |
| 2023 | $6,290 | $477,789 | $477,789 | $0 |
| 2022 | $7,896 | $468,421 | $468,421 | $0 |
| 2021 | $9,020 | $459,237 | $459,237 | $0 |
| 2020 | $8,097 | $454,529 | $454,529 | $0 |
| 2019 | $7,731 | $445,617 | $445,617 | $0 |
| 2018 | $6,010 | $436,880 | $436,880 | $0 |
| 2017 | $7,486 | $428,314 | $428,314 | $0 |
| 2016 | $7,187 | $419,916 | $419,916 | $0 |
| 2015 | $6,709 | $413,609 | $413,609 | $0 |
| 2014 | $5,110 | $405,507 | $405,507 | $0 |
Source: Public Records
Map
Nearby Homes
- 1128 Foxhurst Way
- 1120 Valley Quail Cir
- 1066 Quail Creek Cir
- 1261 Quail Creek Cir
- 21287 Almaden Rd
- 7111 Echo Loop
- 993 Woodview Place
- 6997 Elwood Rd
- 1171 Wilhelmina Way
- 7266 Sleepy Creek Dr
- 7025 Bret Harte Dr
- 6840 Hampton Dr
- 765 Finchwood Way
- 6871 Tunbridge Way
- 6803 Lenwood Way
- 6898 Shearwater Dr
- 6805 Almaden Rd
- 1238 Wooded Hills Dr
- 6698 Charter Oak Place
- 20394 Almaden Rd
- 1356 Shelby Creek Ln
- 1350 Shelby Creek Ln
- 1344 Shelby Creek Ln
- 1338 Shelby Creek Ln
- 1360 Shelby Creek Ln
- 1188 Almaden Oaks Ln
- 1364 Shelby Creek Ln
- 1178 Almaden Oaks Ln
- 1332 Shelby Creek Ln
- 1326 Shelby Creek Ln
- 1304 Tiffany Canyon Ct
- 1320 Shelby Creek Ln
- 1368 Shelby Creek Ln
- 1355 Shelby Creek Ct
- 1314 Shelby Creek Ln
- 1372 Shelby Creek Ln
- 1308 Shelby Creek Ln
- 1158 Almaden Oaks Ln
- 1357 Shelby Creek Ct
- 1335 Shelby Creek Ln