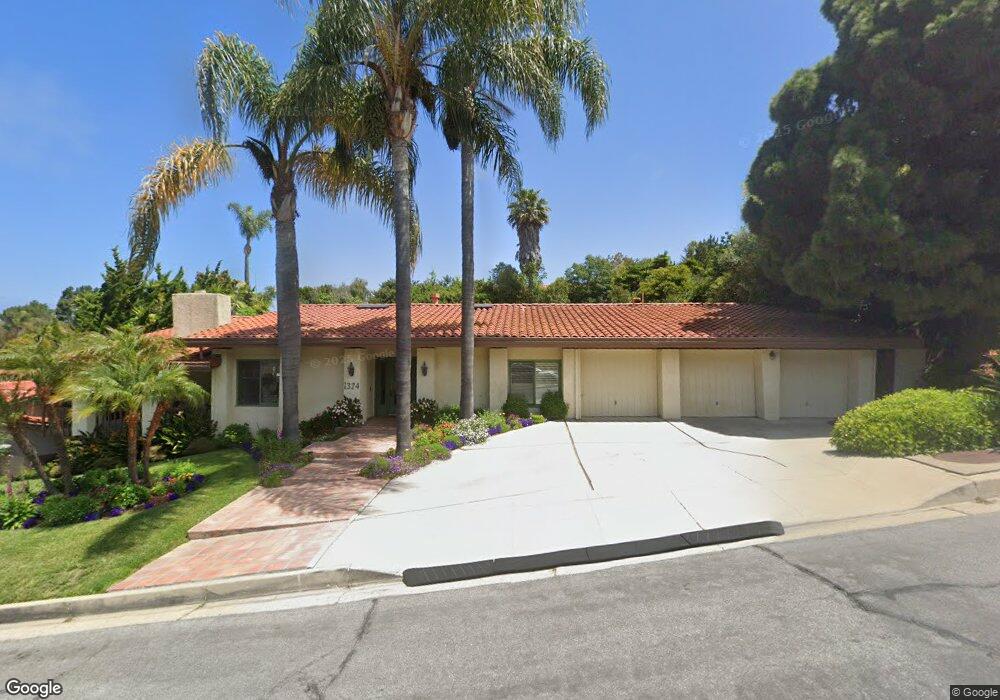
1324 Via Cataluna Palos Verdes Estates, CA 90274
Estimated Value: $2,703,000 - $3,582,000
4
Beds
3
Baths
3,376
Sq Ft
$934/Sq Ft
Est. Value
About This Home
This home is located at 1324 Via Cataluna, Palos Verdes Estates, CA 90274 and is currently estimated at $3,153,319, approximately $934 per square foot. 1324 Via Cataluna is a home located in Los Angeles County with nearby schools including Montemalaga Elementary School, Palos Verdes Intermediate School, and Palos Verdes Peninsula High School.
Ownership History
Date
Name
Owned For
Owner Type
Purchase Details
Closed on
Apr 16, 2003
Sold by
Clark William F and Meyers Jacquelyn
Bought by
Clark William F and Meyers Jacquelyn
Current Estimated Value
Home Financials for this Owner
Home Financials are based on the most recent Mortgage that was taken out on this home.
Original Mortgage
$649,000
Outstanding Balance
$275,733
Interest Rate
5.6%
Mortgage Type
Purchase Money Mortgage
Estimated Equity
$2,877,586
Purchase Details
Closed on
Jan 16, 2001
Sold by
Jen I Cheng and Jen Teh Lin
Bought by
Clark William F and Meyers Jacquelyn N
Home Financials for this Owner
Home Financials are based on the most recent Mortgage that was taken out on this home.
Original Mortgage
$650,000
Interest Rate
7.12%
Mortgage Type
Purchase Money Mortgage
Purchase Details
Closed on
Oct 28, 1994
Sold by
Jen I Cheng and Jen Teh Lin Yeh
Bought by
Jen I Cheng and Jen Teh Lin
Create a Home Valuation Report for This Property
The Home Valuation Report is an in-depth analysis detailing your home's value as well as a comparison with similar homes in the area
Home Values in the Area
Average Home Value in this Area
Purchase History
| Date | Buyer | Sale Price | Title Company |
|---|---|---|---|
| Clark William F | -- | Chicago Title Co | |
| Clark William F | $887,500 | Equity Title | |
| Jen I Cheng | -- | -- |
Source: Public Records
Mortgage History
| Date | Status | Borrower | Loan Amount |
|---|---|---|---|
| Open | Clark William F | $649,000 | |
| Previous Owner | Clark William F | $650,000 |
Source: Public Records
Tax History Compared to Growth
Tax History
| Year | Tax Paid | Tax Assessment Tax Assessment Total Assessment is a certain percentage of the fair market value that is determined by local assessors to be the total taxable value of land and additions on the property. | Land | Improvement |
|---|---|---|---|---|
| 2025 | $16,618 | $1,353,979 | $979,444 | $374,535 |
| 2024 | $16,618 | $1,327,432 | $960,240 | $367,192 |
| 2023 | $16,307 | $1,301,405 | $941,412 | $359,993 |
| 2022 | $15,542 | $1,275,888 | $922,953 | $352,935 |
| 2021 | $15,545 | $1,250,871 | $904,856 | $346,015 |
| 2020 | $15,343 | $1,238,046 | $895,578 | $342,468 |
| 2019 | $14,916 | $1,213,771 | $878,018 | $335,753 |
| 2018 | $14,718 | $1,189,972 | $860,802 | $329,170 |
| 2016 | $13,954 | $1,143,766 | $827,377 | $316,389 |
| 2015 | $13,804 | $1,126,587 | $814,950 | $311,637 |
| 2014 | $13,605 | $1,104,520 | $798,987 | $305,533 |
Source: Public Records
Map
Nearby Homes
- 1325 Via Gabriel
- 1133 Granvia Altamira
- 2457 Via Sonoma
- 1217 Granvia Altamira
- 1300 Granvia Altamira
- 1916 Via Visalia
- 2229 Via Cerritos
- 1815 Via Coronel
- 1409 Via Arco
- 2521 Novato Place
- 1024 Via Nogales
- 6543 Monero Dr
- 6039 Via Sonoma
- 1520 Paseo la Cresta
- 26753 Grayslake Rd
- 27102 Springcreek Rd
- 1129 Via Mirabel
- 1412 Lower Paseo la Cresta
- 869 Rincon Ln
- 28068 Santona Dr
- 1328 Via Cataluna
- 1320 Via Cataluna
- 1329 Via Margarita
- 1333 Via Margarita
- 1325 Via Margarita
- 1329 Via Cataluna
- 1325 Via Cataluna
- 1301 Via Margarita
- 1333 Via Cataluna
- 1332 Via Cataluna
- 1321 Via Cataluna
- 1337 Via Margarita
- 1321 Via Margarita
- 1337 Via Cataluna
- 1317 Via Cataluna
- 1328 Via Margarita
- 2035 Via Visalia
- 2039 Via Visalia
- 1324 Via Margarita
- 1341 Via Margarita