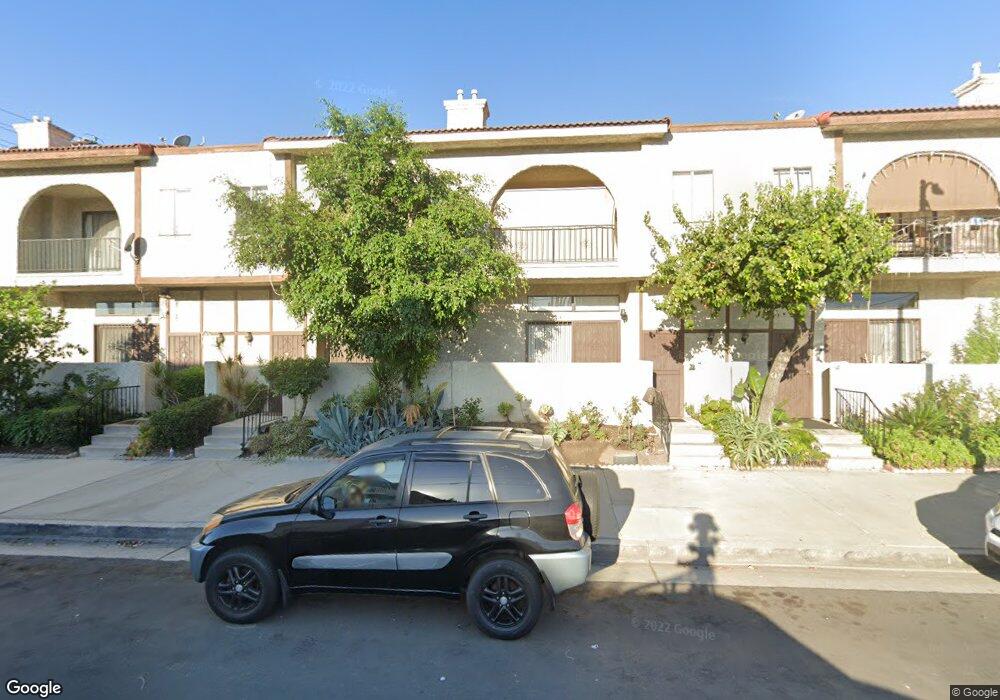
13243 Vanowen St Unit 12 North Hollywood, CA 91605
North Hollywood NeighborhoodEstimated Value: $607,000 - $632,000
2
Beds
3
Baths
1,417
Sq Ft
$434/Sq Ft
Est. Value
About This Home
This home is located at 13243 Vanowen St Unit 12, North Hollywood, CA 91605 and is currently estimated at $614,408, approximately $433 per square foot. 13243 Vanowen St Unit 12 is a home located in Los Angeles County with nearby schools including Coldwater Canyon Elementary, James Madison Middle, and Ulysses S. Grant Senior High School.
Ownership History
Date
Name
Owned For
Owner Type
Purchase Details
Closed on
Jan 10, 2007
Sold by
Azarapetian Movses and Shamilyan Karapet
Bought by
Shamilyan Karapet
Current Estimated Value
Home Financials for this Owner
Home Financials are based on the most recent Mortgage that was taken out on this home.
Original Mortgage
$50,000
Interest Rate
6.09%
Mortgage Type
New Conventional
Purchase Details
Closed on
Nov 21, 2005
Sold by
Azarapetian Movses
Bought by
Azarapetian Movses and Shamilyan Karapet
Purchase Details
Closed on
Dec 9, 1996
Sold by
Glendale Federal Bank Fsb
Bought by
Azarapetian Movses
Home Financials for this Owner
Home Financials are based on the most recent Mortgage that was taken out on this home.
Original Mortgage
$50,000
Interest Rate
7.74%
Purchase Details
Closed on
Apr 22, 1996
Sold by
Greenman Mark W and Glendale Federal Bank Fsb
Bought by
Glendale Federal Bank Fsb
Create a Home Valuation Report for This Property
The Home Valuation Report is an in-depth analysis detailing your home's value as well as a comparison with similar homes in the area
Home Values in the Area
Average Home Value in this Area
Purchase History
| Date | Buyer | Sale Price | Title Company |
|---|---|---|---|
| Shamilyan Karapet | -- | Lawyers Title Company | |
| Azarapetian Movses | -- | -- | |
| Azarapetian Movses | $70,000 | Benefit Land Title Company | |
| Glendale Federal Bank Fsb | $86,749 | Continental Title |
Source: Public Records
Mortgage History
| Date | Status | Borrower | Loan Amount |
|---|---|---|---|
| Closed | Shamilyan Karapet | $50,000 | |
| Previous Owner | Azarapetian Movses | $50,000 |
Source: Public Records
Tax History Compared to Growth
Tax History
| Year | Tax Paid | Tax Assessment Tax Assessment Total Assessment is a certain percentage of the fair market value that is determined by local assessors to be the total taxable value of land and additions on the property. | Land | Improvement |
|---|---|---|---|---|
| 2025 | $5,195 | $423,673 | $126,139 | $297,534 |
| 2024 | $5,195 | $415,366 | $123,666 | $291,700 |
| 2023 | $5,096 | $407,223 | $121,242 | $285,981 |
| 2022 | $4,859 | $399,239 | $118,865 | $280,374 |
| 2021 | $4,795 | $391,412 | $116,535 | $274,877 |
| 2019 | $4,652 | $379,805 | $113,080 | $266,725 |
| 2018 | $4,608 | $372,359 | $110,863 | $261,496 |
| 2016 | $4,396 | $357,902 | $106,559 | $251,343 |
| 2015 | $4,332 | $352,527 | $104,959 | $247,568 |
| 2014 | $3,356 | $264,000 | $78,600 | $185,400 |
Source: Public Records
Map
Nearby Homes
- 6828 Fulton Ave
- 13226 Vanowen St
- 13211 Vanowen St Unit 9
- 6818 Varna Ave
- 6850 Longridge Ave
- 13127 Hartland St
- 13061 Vanowen St
- 7021 Fulton Ave
- 13455 Bassett St
- 13015 Vanowen St
- 7020 Mary Ellen Ave
- 7045 Varna Ave
- 6535 Mary Ellen Ave
- 12938 Vanowen St
- 7115 Park Manor Ave
- 7060 Morse Ave
- 6738 Coldwater Canyon Ave
- 6924 Woodman Ave
- 6535 Ventura Canyon Ave
- 6851 Woodman Ave
- 13243 Vanowen St Unit 9
- 13243 Vanowen St Unit 8
- 13243 Vanowen St Unit 7
- 13243 Vanowen St Unit 6
- 13243 Vanowen St Unit 5
- 13243 Vanowen St Unit 4
- 13243 Vanowen St Unit 3
- 13243 Vanowen St Unit 1
- 13243 Vanowen St Unit 16
- 13243 Vanowen St Unit 15
- 13243 Vanowen St Unit 14
- 13243 Vanowen St Unit 13
- 13243 Vanowen St Unit 11
- 13243 Vanowen St Unit 10
- 13253 Vanowen St Unit 201
- 13253 Vanowen St Unit 206
- 13253 Vanowen St Unit 208
- 6829 Longridge Ave
- 6818 Longridge Ave