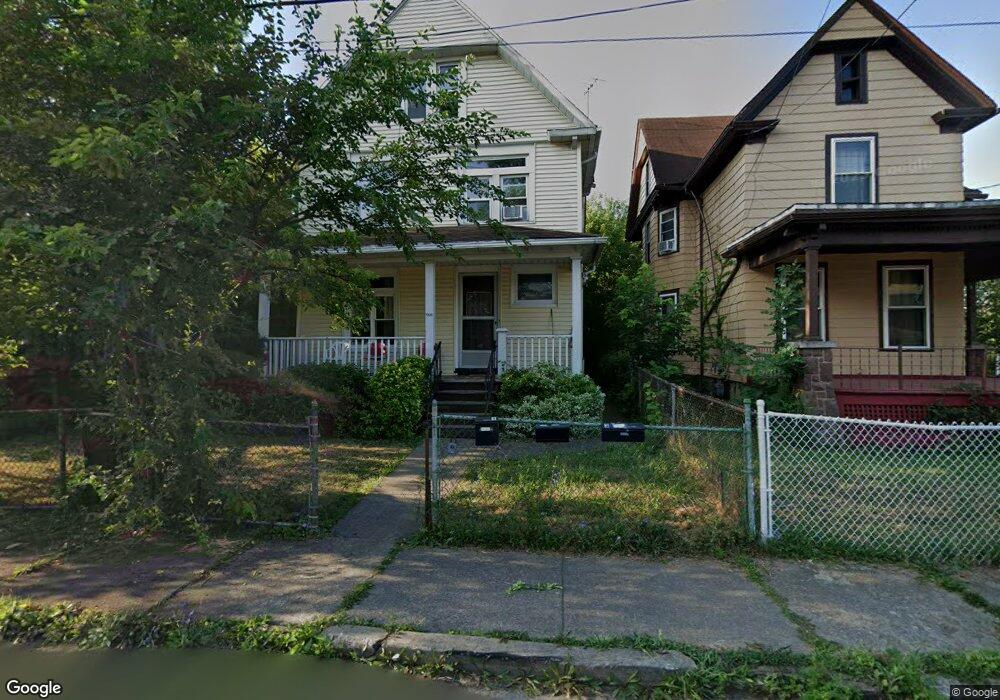
1325 Whitney Ave Unit 3 Niagara Falls, NY 14301
Little Italy NeighborhoodEstimated Value: $60,000 - $96,000
2
Beds
1
Bath
577
Sq Ft
$145/Sq Ft
Est. Value
About This Home
This home is located at 1325 Whitney Ave Unit 3, Niagara Falls, NY 14301 and is currently estimated at $83,667, approximately $145 per square foot. 1325 Whitney Ave Unit 3 is a home located in Niagara County with nearby schools including Niagara Falls High School and St. Joseph Elementary School.
Ownership History
Date
Name
Owned For
Owner Type
Purchase Details
Closed on
Mar 12, 2021
Sold by
Marino Agatha
Bought by
Woodfine Garrett
Current Estimated Value
Purchase Details
Closed on
Nov 25, 2020
Sold by
Bat Sheva Ilany Llc
Bought by
Romeo Jevon and Spence Christopher
Purchase Details
Closed on
Nov 26, 2014
Sold by
"Wing Properties Llc
Bought by
Ilany Bat Sheva
Purchase Details
Closed on
Oct 17, 2014
Sold by
Moody Lenora
Bought by
"Wing Properties Llc
Purchase Details
Closed on
Jul 28, 2008
Sold by
Martinez Rosa M Estate
Bought by
Moody Lenora
Home Financials for this Owner
Home Financials are based on the most recent Mortgage that was taken out on this home.
Original Mortgage
$24,000
Interest Rate
6.49%
Mortgage Type
New Conventional
Purchase Details
Closed on
Dec 13, 1996
Sold by
Conwya Mary
Bought by
Martinez Rosa M
Create a Home Valuation Report for This Property
The Home Valuation Report is an in-depth analysis detailing your home's value as well as a comparison with similar homes in the area
Home Values in the Area
Average Home Value in this Area
Purchase History
| Date | Buyer | Sale Price | Title Company |
|---|---|---|---|
| Woodfine Garrett | $79,787 | None Listed On Document | |
| Romeo Jevon | $40,000 | None Available | |
| Ilany Bat Sheva | -- | Puleo & Puleo | |
| Ilany Bat Sheva | $52,000 | None Available | |
| "Wing Properties Llc | -- | Puleo & Puleo | |
| Moody Lenora | $30,000 | Richard Juda | |
| Martinez Rosa M | $20,000 | -- |
Source: Public Records
Mortgage History
| Date | Status | Borrower | Loan Amount |
|---|---|---|---|
| Previous Owner | Moody Lenora | $24,000 |
Source: Public Records
Tax History Compared to Growth
Tax History
| Year | Tax Paid | Tax Assessment Tax Assessment Total Assessment is a certain percentage of the fair market value that is determined by local assessors to be the total taxable value of land and additions on the property. | Land | Improvement |
|---|---|---|---|---|
| 2024 | $945 | $32,000 | $2,200 | $29,800 |
| 2023 | $945 | $32,000 | $2,200 | $29,800 |
| 2022 | $936 | $32,000 | $2,200 | $29,800 |
| 2021 | $936 | $32,000 | $2,200 | $29,800 |
| 2020 | $621 | $32,000 | $2,200 | $29,800 |
| 2019 | $596 | $32,000 | $2,200 | $29,800 |
| 2018 | $919 | $32,000 | $2,200 | $29,800 |
| 2017 | $596 | $32,000 | $2,200 | $29,800 |
| 2016 | $1,210 | $32,000 | $2,200 | $29,800 |
| 2015 | -- | $32,000 | $2,200 | $29,800 |
| 2014 | -- | $32,000 | $2,200 | $29,800 |
Source: Public Records
Map
Nearby Homes
- 1322 Whitney Ave
- 1310 Whitney Ave
- 1117 13th St
- 1328 Ashland Ave
- 1320 Ashland Ave
- 1325 Ashland Ave
- 1510 Ashland Ave
- 1013 13th St
- 1023 15th St
- 1125 Pierce Ave
- 1533 La Salle Ave
- 1535 Pierce Ave
- 1126 La Salle Ave
- 1121 La Salle Ave
- 1113 Whitney Ave
- 1116 La Salle Ave
- 1748 Ashland Ave
- 825 15th St
- 1706 Whitney Ave
- 2311 16th St
- 1325 Whitney Ave Unit 1
- 1325 Whitney Ave
- 1335 Whitney Ave
- 1323 Whitney Ave
- 1339 Whitney Ave
- 1319 Whitney Ave
- 1317 Whitney Ave
- 1345 Whitney Ave
- 1328 Whitney Ave
- 1313 Whitney Ave
- 1336 Whitney Ave
- 1324 Whitney Ave
- 1328 La Salle Ave
- 1330 La Salle Ave
- 1326 La Salle Ave
- 1340 Whitney Ave
- 1336 La Salle Ave
- 1322 La Salle Ave
- 1338 La Salle Ave
- 1311 Whitney Ave