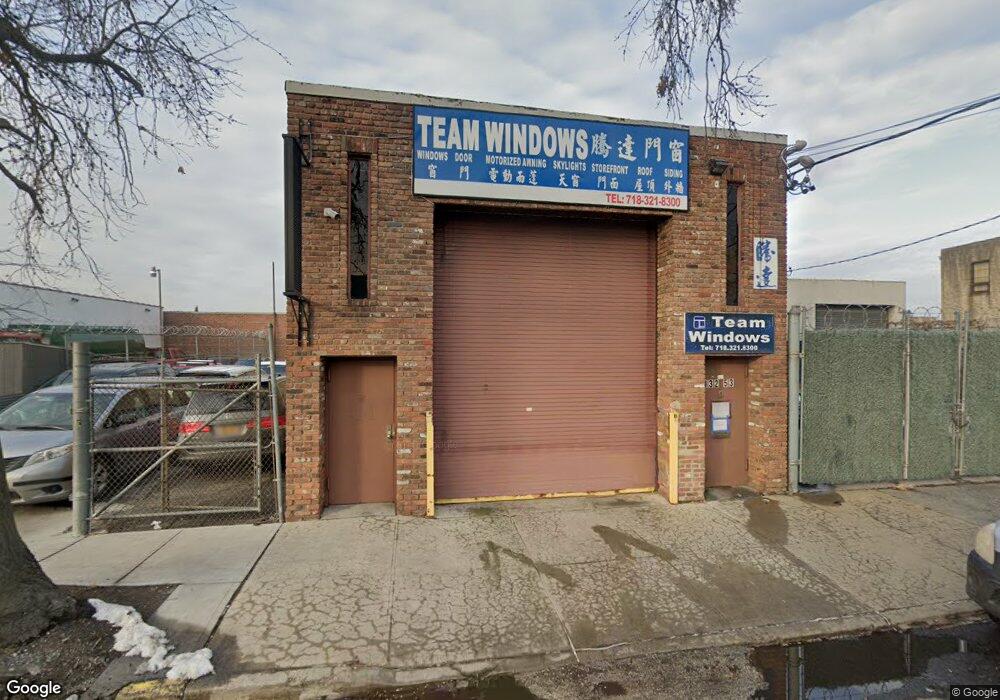
13253 34th Ave Flushing, NY 11354
Flushing-Willets Point NeighborhoodEstimated Value: $2,335,961
Studio
--
Bath
2,350
Sq Ft
$994/Sq Ft
Est. Value
About This Home
This home is located at 13253 34th Ave, Flushing, NY 11354 and is currently estimated at $2,335,961, approximately $994 per square foot. 13253 34th Ave is a home located in Queens County with nearby schools including P.S. 214 Cadwallader Colden, Jhs 185 Edward Bleeker, and Flushing High School.
Ownership History
Date
Name
Owned For
Owner Type
Purchase Details
Closed on
Nov 5, 2025
Sold by
Megaprime Group Llc
Bought by
Horace Gardens Llc
Current Estimated Value
Home Financials for this Owner
Home Financials are based on the most recent Mortgage that was taken out on this home.
Original Mortgage
$1,293,000
Outstanding Balance
$1,290,563
Interest Rate
6.3%
Mortgage Type
Purchase Money Mortgage
Estimated Equity
$1,045,398
Purchase Details
Closed on
Jan 29, 2014
Sold by
Nma Realty Llc
Bought by
Megaprime Group Llc
Home Financials for this Owner
Home Financials are based on the most recent Mortgage that was taken out on this home.
Original Mortgage
$1,100,000
Interest Rate
4.32%
Mortgage Type
Commercial
Purchase Details
Closed on
Mar 28, 2006
Sold by
Marinucci Anthony and Marinucci Marie
Bought by
Marinucci Anthony and Marinucci Kimberly A
Purchase Details
Closed on
Jun 14, 2001
Sold by
Marinucci Anthony and Marinucci Marie
Bought by
Marinucci Anthomy and Marinucci Kimberly A
Purchase Details
Closed on
Dec 12, 2000
Sold by
Marinucci Anthony and Marinucci Marie
Bought by
Marinucci Anthony and Marinucci Kimberly A
Create a Home Valuation Report for This Property
The Home Valuation Report is an in-depth analysis detailing your home's value as well as a comparison with similar homes in the area
Home Values in the Area
Average Home Value in this Area
Purchase History
| Date | Buyer | Sale Price | Title Company |
|---|---|---|---|
| Horace Gardens Llc | $2,350,000 | -- | |
| Megaprime Group Llc | $1,330,000 | -- | |
| Megaprime Group Llc | $1,330,000 | -- | |
| Megaprime Group Llc | $1,330,000 | -- | |
| Marinucci Anthony | -- | -- | |
| Marinucci Anthony | -- | -- | |
| Marinucci Anthony | -- | -- | |
| Marinucci Anthomy | -- | -- | |
| Marinucci Anthomy | -- | -- | |
| Marinucci Anthony | -- | Fidelity National Title Ins | |
| Marinucci Anthony | -- | Fidelity National Title Ins |
Source: Public Records
Mortgage History
| Date | Status | Borrower | Loan Amount |
|---|---|---|---|
| Open | Horace Gardens Llc | $1,293,000 | |
| Previous Owner | Megaprime Group Llc | $1,100,000 |
Source: Public Records
Tax History
| Year | Tax Paid | Tax Assessment Tax Assessment Total Assessment is a certain percentage of the fair market value that is determined by local assessors to be the total taxable value of land and additions on the property. | Land | Improvement |
|---|---|---|---|---|
| 2025 | $28,265 | $273,150 | $80,100 | $193,050 |
| 2024 | $28,265 | $266,850 | $80,100 | $186,750 |
| 2023 | $28,598 | $270,000 | $80,100 | $189,900 |
| 2022 | $28,196 | $290,250 | $80,100 | $210,150 |
| 2021 | $26,323 | $246,150 | $80,100 | $166,050 |
| 2020 | $26,534 | $264,150 | $80,100 | $184,050 |
| 2019 | $25,587 | $257,400 | $80,100 | $177,300 |
| 2018 | $23,808 | $226,440 | $66,870 | $159,570 |
| 2017 | $21,016 | $199,886 | $62,460 | $137,426 |
| 2016 | $18,376 | $199,886 | $62,460 | $137,426 |
| 2015 | $8,634 | $148,316 | $58,050 | $90,266 |
| 2014 | $8,634 | $126,986 | $58,050 | $68,936 |
Source: Public Records
Map
Nearby Homes
- 34-00 Linneaus Place
- 33-19 Prince St Unit 10A
- 33-19 Prince St Unit 10L
- 33-19 Prince St Unit 8L
- 33-19 Prince St Unit 11A
- 134-03 35th Ave
- 33-71 Prince St Unit 9G
- 33-71 Prince St Unit 12J
- 33-71 Prince St Unit 11I
- 33-71 Prince St Unit 7F
- 33-71 Prince St Unit 6C
- 33-71 Prince St Unit 11H
- 33-71 Prince St Unit 9C
- 33-71 Prince St Unit 6A
- 33-71 Prince St Unit 14E
- 33-71 Prince St Unit 10D
- 33-20 Farrington St
- 33-66 Farrington St Unit 10I
- 33-66 Farrington St
- 33-66 Farrington St Unit 11I
- 13245 34th Ave
- 13255 34th Ave
- 13243 34th Ave
- 13257 34th Ave
- 13241 34th Ave
- 13259 34th Ave
- 13239 34th Ave
- 3304 Downing St
- 13261 34th Ave
- 13256 34th Ave
- 13235 34th Ave
- 3237 Downing St
- 13260 34th Ave
- 13230 33rd Ave
- 13233 34th Ave
- 3370 Collins Place
- 13270 34th Ave
- 132-25 34th Ave
- 3227 Downing St
- 3402 Linnaeus Place
Your Personal Tour Guide
Ask me questions while you tour the home.