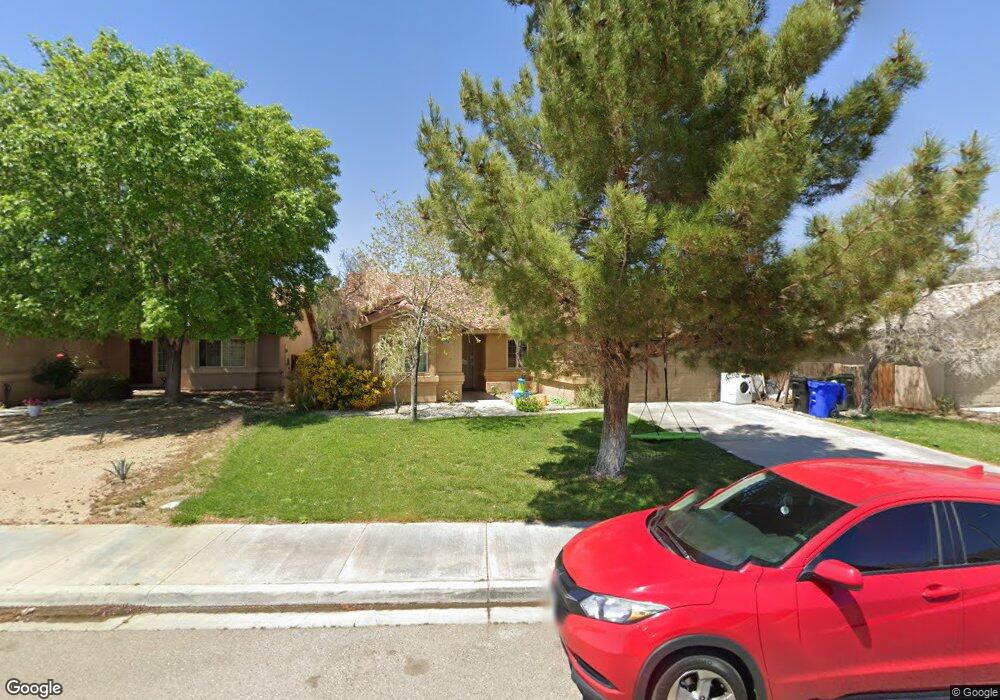
13256 Great Falls Ave Victorville, CA 92395
Estimated Value: $377,000 - $474,000
3
Beds
2
Baths
1,880
Sq Ft
$222/Sq Ft
Est. Value
About This Home
This home is located at 13256 Great Falls Ave, Victorville, CA 92395 and is currently estimated at $416,875, approximately $221 per square foot. 13256 Great Falls Ave is a home located in San Bernardino County with nearby schools including Lomitas Elementary School, Mojave Vista Elementary School, and Lakeview Leadership Academy.
Ownership History
Date
Name
Owned For
Owner Type
Purchase Details
Closed on
Jan 16, 2009
Sold by
Vo Annie
Bought by
Mai Sean
Current Estimated Value
Purchase Details
Closed on
Feb 11, 2005
Sold by
Calico Homes Development
Bought by
Vo Annie
Home Financials for this Owner
Home Financials are based on the most recent Mortgage that was taken out on this home.
Original Mortgage
$156,720
Outstanding Balance
$73,674
Interest Rate
4.62%
Mortgage Type
Purchase Money Mortgage
Estimated Equity
$343,201
Purchase Details
Closed on
Jan 13, 2005
Sold by
Cao Michael
Bought by
Vo Annie
Home Financials for this Owner
Home Financials are based on the most recent Mortgage that was taken out on this home.
Original Mortgage
$156,720
Outstanding Balance
$73,674
Interest Rate
4.62%
Mortgage Type
Purchase Money Mortgage
Estimated Equity
$343,201
Purchase Details
Closed on
Dec 18, 2002
Sold by
Abrishami Minoo
Bought by
Abrishami Elias
Create a Home Valuation Report for This Property
The Home Valuation Report is an in-depth analysis detailing your home's value as well as a comparison with similar homes in the area
Home Values in the Area
Average Home Value in this Area
Purchase History
| Date | Buyer | Sale Price | Title Company |
|---|---|---|---|
| Mai Sean | -- | None Available | |
| Vo Annie | $196,000 | Chicago Title Company | |
| Vo Annie | -- | Chicago Title Company | |
| Abrishami Elias | -- | Fidelity National Title |
Source: Public Records
Mortgage History
| Date | Status | Borrower | Loan Amount |
|---|---|---|---|
| Open | Vo Annie | $156,720 |
Source: Public Records
Tax History Compared to Growth
Tax History
| Year | Tax Paid | Tax Assessment Tax Assessment Total Assessment is a certain percentage of the fair market value that is determined by local assessors to be the total taxable value of land and additions on the property. | Land | Improvement |
|---|---|---|---|---|
| 2025 | $1,791 | $150,671 | $37,347 | $113,324 |
| 2024 | $1,791 | $147,717 | $36,615 | $111,102 |
| 2023 | $1,772 | $144,821 | $35,897 | $108,924 |
| 2022 | $1,741 | $141,981 | $35,193 | $106,788 |
| 2021 | $1,710 | $139,197 | $34,503 | $104,694 |
| 2020 | $1,679 | $137,769 | $34,149 | $103,620 |
| 2019 | $1,651 | $135,067 | $33,479 | $101,588 |
| 2018 | $1,758 | $132,419 | $32,823 | $99,596 |
| 2017 | $1,722 | $129,822 | $32,179 | $97,643 |
| 2016 | $1,688 | $127,276 | $31,548 | $95,728 |
| 2015 | $1,628 | $125,364 | $31,074 | $94,290 |
| 2014 | $1,598 | $122,908 | $30,465 | $92,443 |
Source: Public Records
Map
Nearby Homes
- 13077 1st Ave
- 13035 Troy Ct
- 13357 Calcite Ave
- 16605 Ottawa St
- 16654 Sholic St
- 16591 Ponca St
- 16931 Sorrento Ln
- 13554 2nd Ave
- 12733 Appian Ave
- 16850 Hidden Creek Dr
- 12764 Amber Creek Cir
- 16780 Green Tree Blvd
- 16585 Green Tree Blvd
- 12814 Hawks Hill St
- 16976 Torino Dr
- 13432 Jubilee Place
- 16546 San Juan Place
- 13430 Jubilee Place
- 13486 Jubilee Place
- 0 0 S459-C Dock Unit HD25244848
- 13266 Great Falls Ave
- 13248 Great Falls Ave
- 13274 Great Falls Ave
- 13240 Great Falls Ave
- 13255 Butte Ave
- 13265 Butte Ave
- 13247 Butte Ave
- 13282 Great Falls Ave
- 13273 Butte Ave
- 13232 Great Falls Ave
- 13239 Butte Ave
- 13257 Great Falls Ave
- 13247 Great Falls Ave
- 13281 Butte Ave
- 13265 Great Falls Ave
- 13231 Butte Ave
- 13237 Great Falls Ave
- 13224 Great Falls Ave
- 13292 Great Falls Ave
- 13275 Great Falls Ave